GBPNZD Analysis & Trading Plan - 15 August 2024 #forex #trading #forexsignals #fyp #shorts
15 Aug 2024 · 1 min
0:58
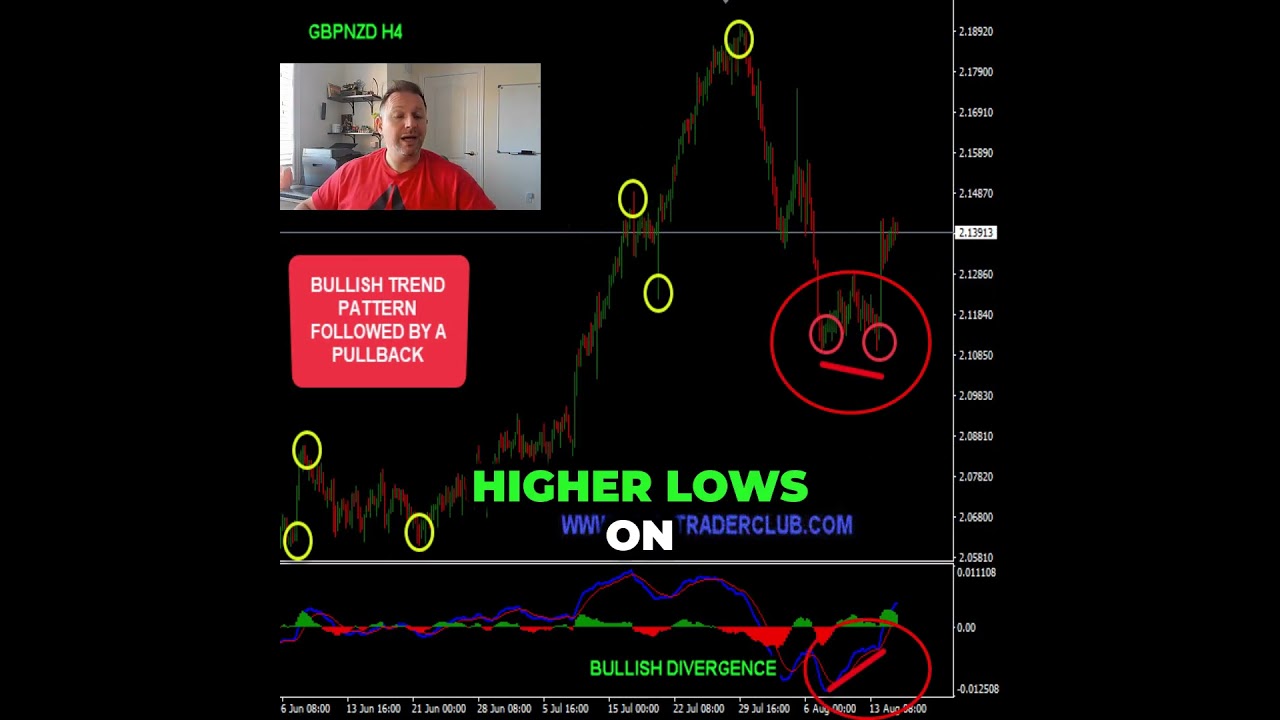
Vladimir Ribakov analyzes GBP/NZD using daily and 4-hour charts. He spots a bullish hidden divergence on the daily chart where price makes higher lows while MACD makes lower lows, plus a rising support line holding. On the 4-hour chart, a pullback stalls between 50% and 61.8% Fibonacci levels, signaling more upside if these support levels hold.
Chapters
More from Vladimir






youtube.com
Stop Buying USDJPY: The Critical Resistance You Need To See #forex #tradingstrategy #shorts
2w ago




See all content
