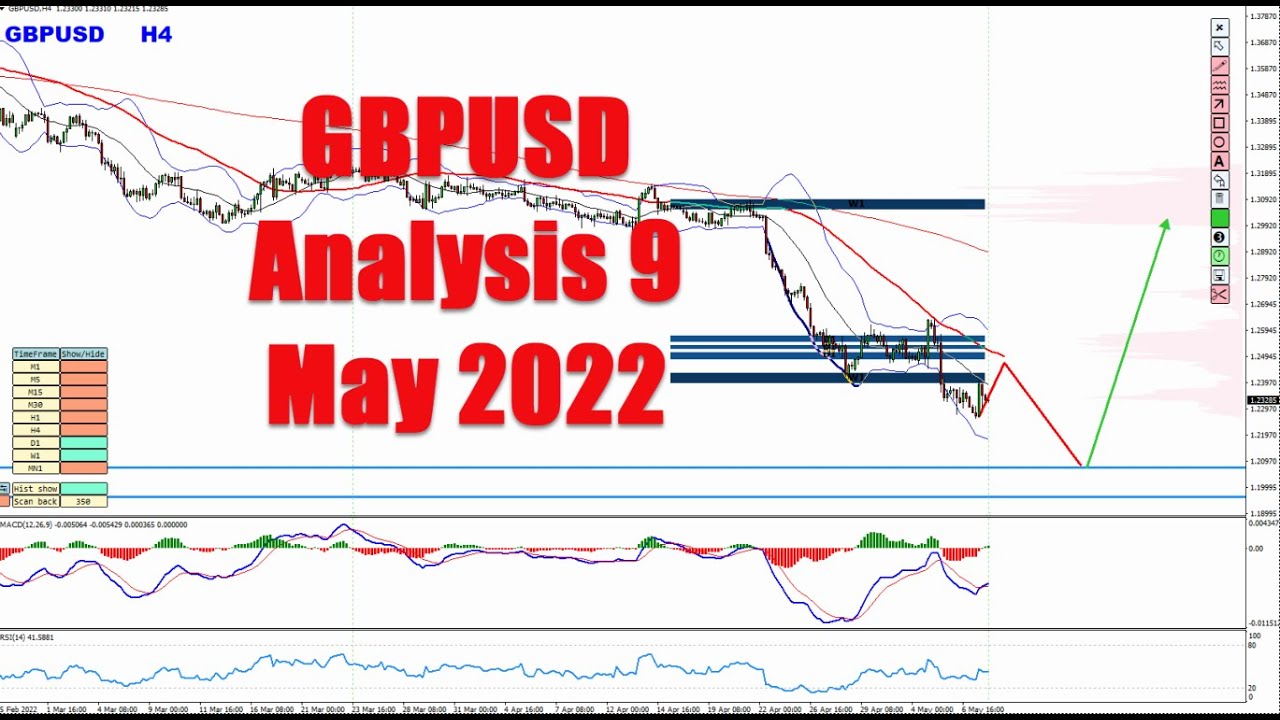
In this YouTube video Vladimir Ribakov provides a follow‑up technical analysis of the GBP/USD pair, building on his April 27 forecast that anticipated a downward move. He reviews weekly, daily and 4‑hour charts, highlighting key support zones derived from recent lows and volume‑profile based “Key Trading Levels”. Ribakov explains how he expects bear pressure to weaken in the coming weeks as market participants digest US data, leading to a potential bottom near the identified support zones. He describes the expected indicator behavior – MACD forming a low with upward ticks, RSI entering oversold territory around 20, and possible divergence on moving averages – as confirmation of the slowdown. He outlines several price‑action scenarios: a fake low followed by a false breakout and a trend flip that could generate buying opportunities; an alternative ranging slowdown that could later resume a bullish rally. Throughout, he promotes his free “Virtual Trading Pen” and “Key Trading Level” indicators (available via links in the description) and invites viewers to join his Traders Academy Club for premium trading education and real‑time ideas. The video concludes with a call to like, comment, and subscribe.
Chapters
Hello traders, how are you? Vladimir here from Traders Academy Club. In this video, my analysis and price prediction on the pound dollar. Today we are on 9th of May 2022, and this video would be a follow-up to the analysis I shared with you on the pound dollar on 27th of April. If you missed this video, you can find it in my channel and watch the whole analysis behind it. But before we go to the charts, and I want to explain the analysis behind it, if you are new to this channel, welcome to our amazing community. Please subscribe to the channel with the subscribe button below the video. And also, I invite you to join us in our trading family, Traders Academy Club. Enjoy the full VIP price action course. Enjoy all our real-time trading ideas Real-time trading education. Every single trading opportunity comes with a detailed dedicated video that you receive explaining all my trading techniques behind it. To join our family, follow the link below in the description or in the pinned comment in the, um, comment section. So now back to the pound-dollar. As I said, this is a follow-up to the video I shared with you on 27th of April. If you missed it You can find it directly on the channel, or right now on the right top corner of this video, I'll put direct link there so you can watch it and see what was, uh, it all about and why we expected to see eventually the move down happening, which it did. So now the question is, until when? And the way I see that, we start to run of the steam. The bears, I anticipate, on the coming weeks would start to slow down as the market anticipates what's going on in the US. Britain will have eventually to follow and maybe even go more aggressive. So I believe it will find convenient, I would say, bottom soon. The question is, where is this soon? And the way I see that, this soon should be right next to these key lows. One low we have already in play, but doubtful it's over. So the next 2 lows from the weekly chart could be great, great, great supportive areas. And in this area Ideally with MACD creating a low and ticks upside, and RSI finds some convenient bottom around the oversold zone in 20. Then we will go to the daily chart, and that, that's where I believe we should be, uh, seeing this slowdown building up. So something like that. Let's put the levels again. Okay, and then we go to the daily chart. By the way, uh, this indicator which I draw on the charts, it's my virtual trading pen. This indicator and the key trading levels indicator based on volume profile, both indicators are available for you for free. You can go and download them. You can find the link below this video in the description. Find the KTL, Key Trading Level indicator, and the Virtual Trading Pen. These are the indicators you can download for free there. Uh, just install them and enjoy them the same way I do. Uh, so these are the levels going down to the daily. As I said before, I believe closer to this zone we should see some slowdown here, divergence to build up, ideally even on the moving averages. And from here, this is the zone I believe we should be turning upside on the four-hour chart. Very likely to assume, and usually this is how it happens. Just take it back. It will start to build this convenient bottom. Okay, we will we likely to see here fake low. So a new low pullback, a new low pullback. What creates false breakout. And eventually what will happen, uh, with very big probability is— let me just take it down— is that we will create a low, okay, and then false breakout, and then a flip. So this trend flip is usually where the opportunity start to build up and provide us the buys opportunities. What could happen as alternative is we could see some ranging here scenario, something like that in the slowdown variant, and then boom, also goes through all the previous highs and taking it All the way to the bullish cycle once again. So this is my view on the pound-dollar. If you enjoy these videos and the other videos I upload for you in the channel, make sure to hit this like button. If you have any questions, feel free to ask in the comment section below. If you have any instruments that you would like me to share my analysis with you, I'll be more than happy to help. Of course, if I, uh, have this, uh, if I have a view on this instrument you are interested. And once again, I would like to invite you to join us in our trading family, Traders Academy Club. Enjoy the best of the value we have to offer with the link below in the description below this video. And don't forget to download the virtual trading pen and the key trading levels. The links to them are below this video in the description. As well. Thanks for your time watching this video. I'll see you soon with more. I wish you and yours all the best. Bye for now. Stay safe.