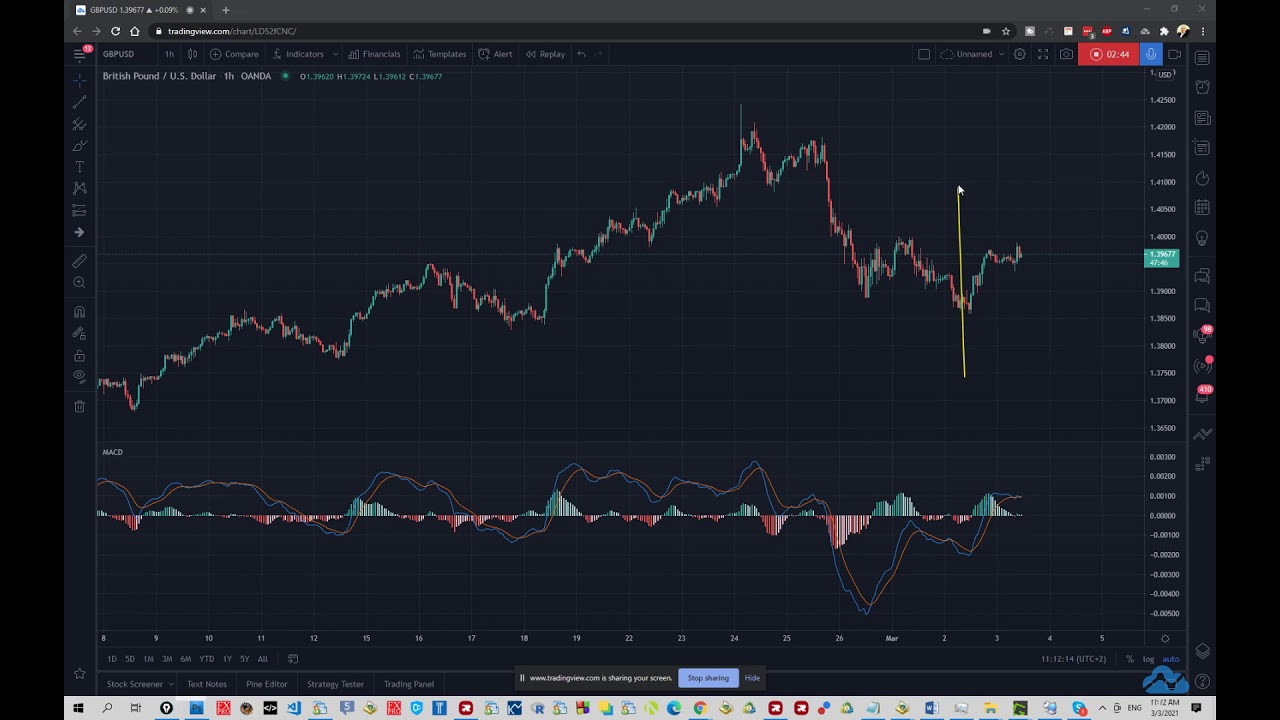
A Traders Academy Club analyst examines GBP/USD across multiple timeframes and identifies a potential short setup. The pair has rallied without healthy pullbacks to around 140-141, showing bearish divergence on the daily chart. He uses Fibonacci retracements, particularly the 38.2% level around 141.00, to find confluence zones for entering a short position.
Chapters
trader in the Traders Academy Club. Today I would like to share with you this idea on the cable GBP/USD. Um, basically it all starts for me from the weekly time frame and this level, right? So what we're looking at here is some sort of cycle which is coming closer to either a deeper pullback Or complete reversal. In my opinion, we're going to see something like that and probably extending these waves here. But the idea is very simple: we came very close to this zone. This is a really extended move without any any without any major pullbacks, without any healthy pullbacks to the downside to to continue gaining the momentum. Right? It is slowly crawling to the upside. And it's kind of creating a micro bubble here. We can see that from the previous— let me go back, um, the 140-141 zone right here was tested and we saw this beautiful rejection candle, right, with the spike pin bar or whatever you want to call it. On the daily chart, look where the divergence started from. So basically no volume, no volume, no volume, right? A lack of real momentum behind this move. They're pushing the price up and then we're exploding with this one last push to the upside. So basically I would be looking at this as something like that. Excuse me. And the question is, do we go down from that zone or we're going to clear slightly higher again, create one final attempt here before pushing lower. Those are the 2 scenarios that I'm looking, uh, in at the moment. And to be honest, it starts to look pretty decent because once we drop to the 1-hour chart or the 4-hour charts, we can see a very obvious and clear pattern, bearish trending pattern here, impulsive structure, right, depending on the terms that you're going to use. In your methods, but what this is telling us is we're looking at potential sell opportunity. So what do we do? Well, first of all, we start looking for the pullbacks, right? After this kind of pattern, we are supposed to get some kind of pullback here, right? And then we want to be looking at potential continuation, continuation to the downside. So what do I do? I'm trying to identify what's happening after this point and whether on this part we're going to start building again, um, impulsive structures, which means we're probably going to higher level somewhere, maybe even new high to be created, or we're going to start creating zigzags and double waves and so on, which would be suggesting that we are probably going to move to the downside. Now, as we can see at that stage on H1, at least there is just one wave pullback, and we managed to break above this first high, uh, and now the price is right here. So the picture is not yet clear. I just wanted to share this idea as it starts to develop, right? So you have time to analyze it, to think about it. I don't want to be sharing it in the moment when it's almost done and you gotta be immediately jumping in, right? So basically I'm trying to, uh, find here a setup for the sell side. Also, we want to be looking at levels, and in order to get the best levels in this case, we need to check out first of all the Fibos. At least this is how I'm fighting finding my best levels. We're then going to drop some— where is that? Here was it— uh, rectangles on the chart and see where the price is actually fitting with the Fibos. Plus we can always drop here some trend lines as well. And what we do now is we just try to figure out what— in what places What zones are coinciding with other zones and making very, very strong levels. So we can see that this is the first Fibonacci level, the 38.2, which was already respected once, but that was on the previous move, so it doesn't really count. Now we have a new low, and the actual 38.2 is now moved. It was slightly moving, but again So you can see that this is pretty much the entire— the— excuse me, guys— the big zone. That's the one. In other words, I would love to see the price holding below right here, okay? This zone, this is approximately the 141. So even if we're going for sort of ABC, we want to be holding below We want to see bearish divergences which are supporting the bearish view on the continuation to the downside. And yeah, pretty much that's, that's what this setup is about. We have the levels, we have the structure, we have the higher time frame levels, we have the higher time frame structure. We're just looking for a setup from the optimal places which are right here, and then we're going to extra confirm that with the versions if possible. I guess that, that would be all. If you have any questions, make sure to leave us a comment below and we'll get back to you as soon as possible. That would be all. Thank you. Have a good one. Thank you.