GBPUSD Sell alert - 10 Nov.2025 #forex #gbpusd #forexsignals #trading #hometraderclub
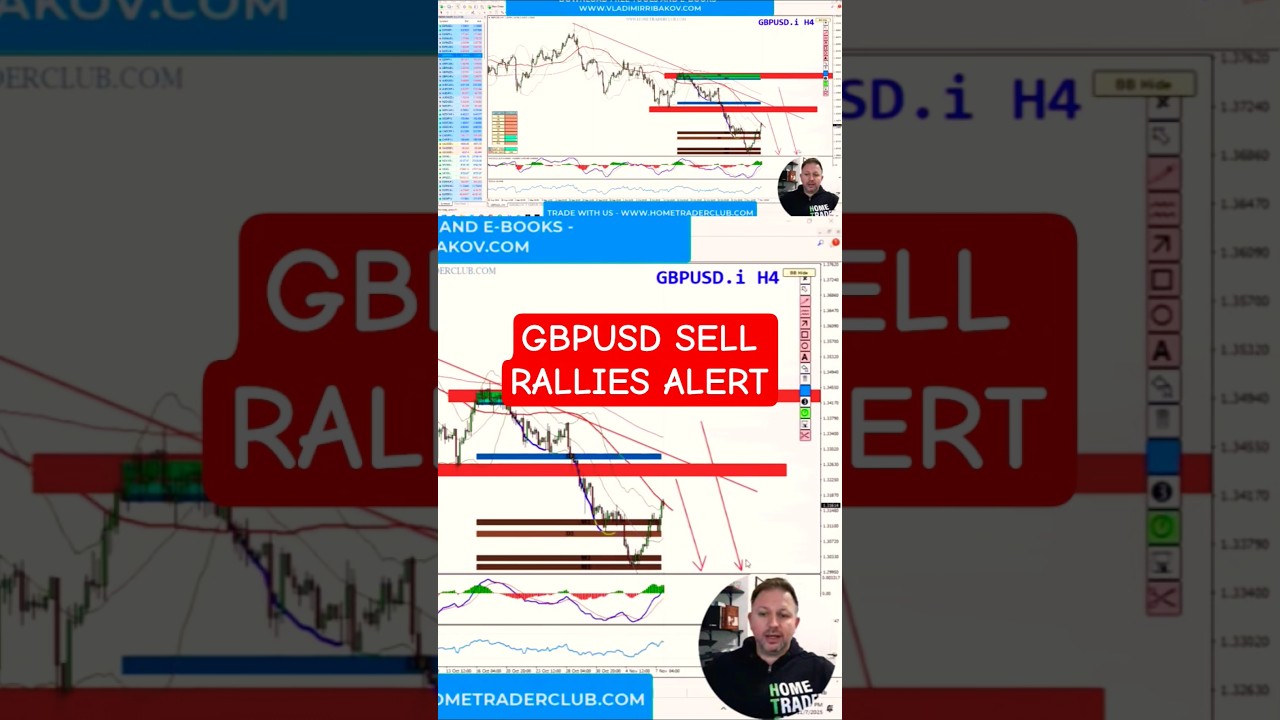
In this video Vladimir Ribakov provides a technical analysis of the GBP/USD pair, describing a corrective down‑trend that followed a sharp drop and a retest of the previous daily low. He notes the absence of reversal signals and points to lower lows on price, MACD moving averages, and RSI as confirming the bearish bias. On the 4‑hour chart, a falling dynamic resistance line similar to the EUR/USD is highlighted, with a broken support around 1.3250 now acting as resistance. He also identifies a daily supply/volume‑profile zone between 1.3400 and 1.3450 as a key resistance area. Ribakov concludes that, as long as these levels hold, the appropriate trading approach is to “sell the rallies.”
Chapters
More from Vladimir






Stop Buying USDJPY: The Critical Resistance You Need To See #forex #tradingstrategy #shorts




