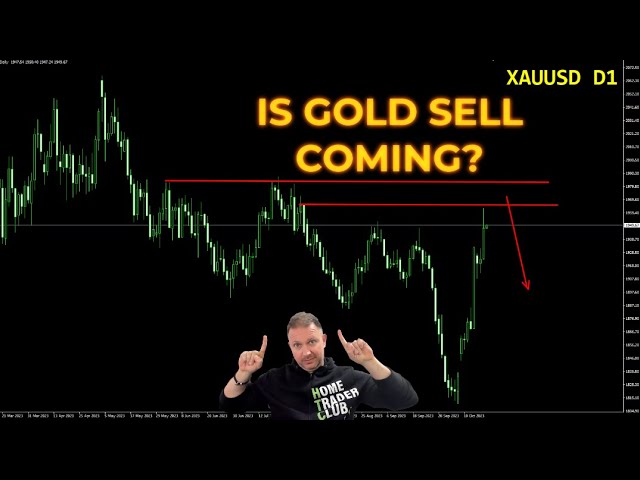
Vladimir Ribakov analyzes gold's short-term sell setup while staying bullish long-term. Price has rallied hard on inflation and Middle East tensions, but technical signals show divergence and overbought conditions on the Bollinger Bands. He's targeting a pullback to a volume-profile zone, with strict risk management on position size and reward ratios.
Chapters
Hello traders, how are you? Vladimir here from Home Trader Club, and in this video I want to talk about the gold. Is it time to look for sell opportunities? If so, is it only for the short term or maybe it's for the long term? So let's take a look what happens on the chart And why I believe gold could be a very interesting opportunity. Let's take a look. But before that, big thumbs up and thanks to Eightka Broker for supporting me, my team, and my community. And as part of our partnership, there is a special offer for private mentoring. Learn all the information, all the details with the description below this video. Now let's take a look what happens on gold. As I shared with you on the most recent weekly forecast, and please make sure you watch that, uh, on the right top corner of this video you can find the direct link in case you missed it. Make sure you watch it so you understand the whole analysis behind it. As Uh, we discussed on the last weekly forecast. The idea was pullbacks and further continuation towards a supply area from the daily chart. So take a look what happens here on a daily chart. We reach this very supply zone. All this area, we're very close to that, right? Uh, all this zone is zone of sellers. Every time since this moment the market was there, there was a selling pressure coming up. And that's what I believe could happen this time as well. As the price reaches this zone or comes close to this zone, the short-term pressure might begin and pullbacks could happen. Is that a switch of a trend? I don't think so. I think it's a normal, realistic pullback before further continuation, potentially All the way to all-time high, and my view remains bullish as long as this zone of invalidation will hold. So what causes all this current recent rally in gold? Many reasons. Of course, it starts with inflation and everything, but the current situation politically, geopolitically. You name it, with the terrible war going on in the Middle East affects— the fear is, is absolute here. The fear that this war will spread beyond the territory of Israel spreads the fear in the market, and that's exactly what Currently puts this fuel the buyers were looking for. But let's leave the fundamental aside. Technically speaking, this zone is a key zone, not just in terms of supply. But take a look what happens on the Bollingers: a direct move from the lower band to the upper band. You can see how wide it is. Usually, such moves tend to stop within 50% deviation of the Bollinger Band range, meaning from top to the middle is. 50% of the whole movement. Okay. Within the 50% of this range, these moves tend to stop, which makes me think that this rally probably will start and run out of steam before the pullback actually takes place back to this zone of buyers. Okay. Or this volume profile based balance zone. So if we take that and go to the 4-hour chart to look for this opportunity, take a look what happens in the 4-hour chart. We are riding for more than 20 candles on the upper Bollinger Band. Last time it happened was here. You remember this crash on the Bollinger Band, and we we saw what happened since. Now I don't claim that it will crash from here. No, but with this rally, the supply zone that is being reached on the daily chart, the bearish divergence developing here on all the indicators while the market is making these higher highs, indicators start to make. Lower highs. Clear indication that the buyers are slowly losing their grip in this situation. And if we plot Fibonacci, uh, expansion on these legs, what we can see is we are here on a key zone of Fibonacci, which makes me think as we enter this zone, we should see some slowdown signs, possibly fake highs and a pullback back to this volume profile zone and, uh, down to potentially the next, uh, demand areas, which is the previous lows where the buyers took that control from. Okay, so if we take that and we go to the 1-hour chart, you will see how it's, uh, sort of synchronizing itself with the 4-hour chart. We have the divergence, of course. But also these most recent highs could start and make this own divergence, right? And that's what makes me think that if we actually manage to see fake rallies, like fake highs, highs and attempts, uh, that fails and pushes down, right? Fake, uh, fake attempts to break above the previous high which immediately retraces back. If that happens, we have the green light to look for these short-term sells back to this volume zone. As I said, also this dynamic supportive line could be, uh, used to find the short-term targets. And from there, assuming it will actually take place on the coming days, from there very possibly looking for the next buy opportunities With the higher time frame. So that's pretty much it on the gold. Is it time to look for sales? I believe it's coming as long as the supply zone holds. Very important. And is it short term or long term? I believe you got the answer from my video. Share with me your thoughts of gold. Do you think the correction is coming soon, or you think it's only buy, buy, buy, or buy the dips is actually more conservative? play here. Also, I want to mention, when you trade aggressive setups against higher time frame, make sure you control the numbers, because without controlling numbers, there is no way to make money in trading, first of all. But control— by controlling numbers, I mean even when you trade more aggressive setups, you must respect your average risk-reward ratio. So in case one time it fails, the next time it pays off, you mathematically find yourself in a position when— where you keep your growth, where you keep gaining your returns. You must make the numbers work for you. You must keep the numbers in your favor, in a positive direction, of course. And that's the only way to make it happen. Okay, very important, because many traders, they just Oh, but I saw a sell recommendation, so a buy recommendation. They just enter all in, no clue what— how much money they actually risk, and then they like, um, what do I do, right? I'm about to blow my account. So be in control with the numbers. It's that important in every setup you trade, whether it's aggressive or conservative. So what do you think about the gold? Share with us in the comment section. Thanks for your time watching this video. I hope you find value watching it, and if you do, please don't forget to hit this like button below this video and subscribe to the channel if you are new to this channel. Just remember to enable the notification so you know when there is new content available for you. And also, I invite you to our trading family, Home Trader Club. Enjoy your access to our full comprehensive trading courses for beginners and advanced, me— rich media zone, real-time trading ideas, real-time trading opportunities, real-time trading education, access to the community, access to trading tools, and so much more. Join our family with the link below this video in the description. Thanks for your time once again. I'll see you soon with more. Good trading. Bye for now.