How to Find And Trade Bullish Trendlines
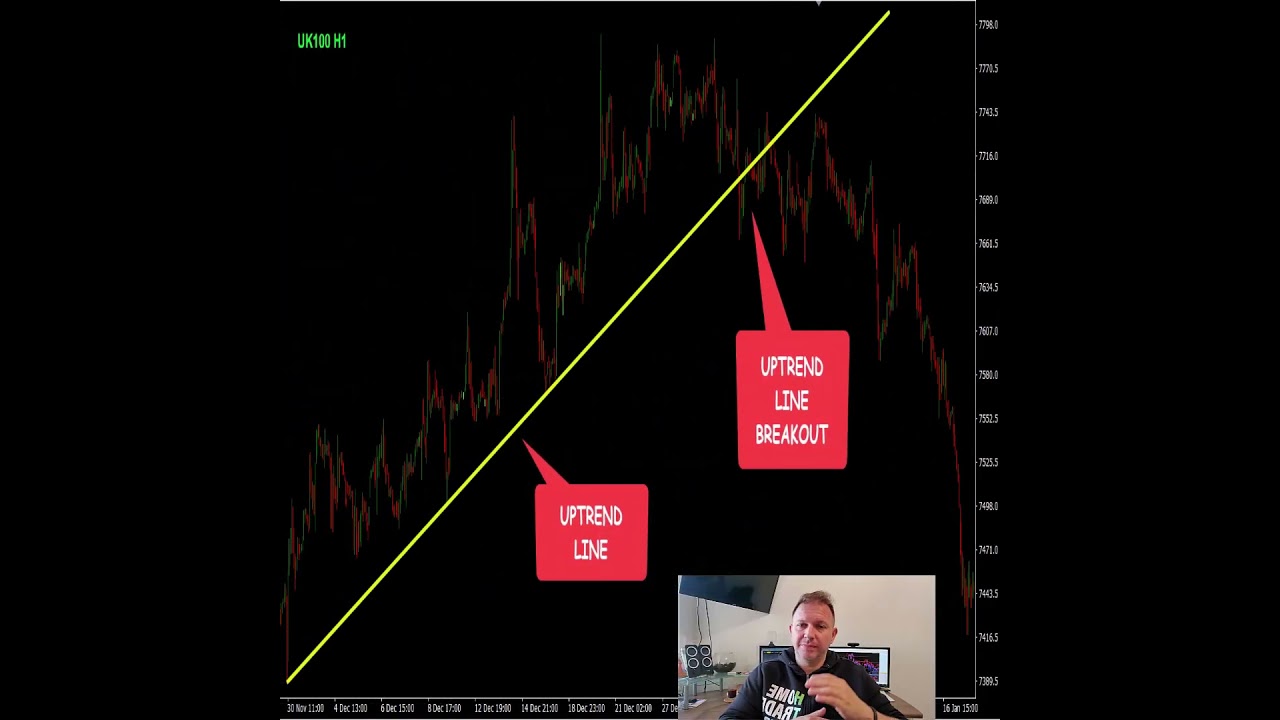
In this tutorial Vladimir Ribakov explains how to identify and trade bullish trendlines. He defines a bullish trend as a series of higher highs and higher lows, and describes that a trendline is drawn by connecting at least two price points, with three points needed to validate it. A valid bullish trendline must link at least three higher lows, acting as dynamic support: each bounce above the line suggests further upside. Ribakov notes that when price breaks below the trendline and stays below, it signals a potential trend reversal, often confirmed by a retest and rejection. He illustrates the concepts with two chart examples: the UK 100 index, where a classic bullish trendline is broken and the price moves down, and a CAD/CHF four‑hour chart showing a bullish trendline that is eventually broken to the downside, leading to a downtrend.
Chapters
More from Vladimir






Stop Buying USDJPY: The Critical Resistance You Need To See #forex #tradingstrategy #shorts




