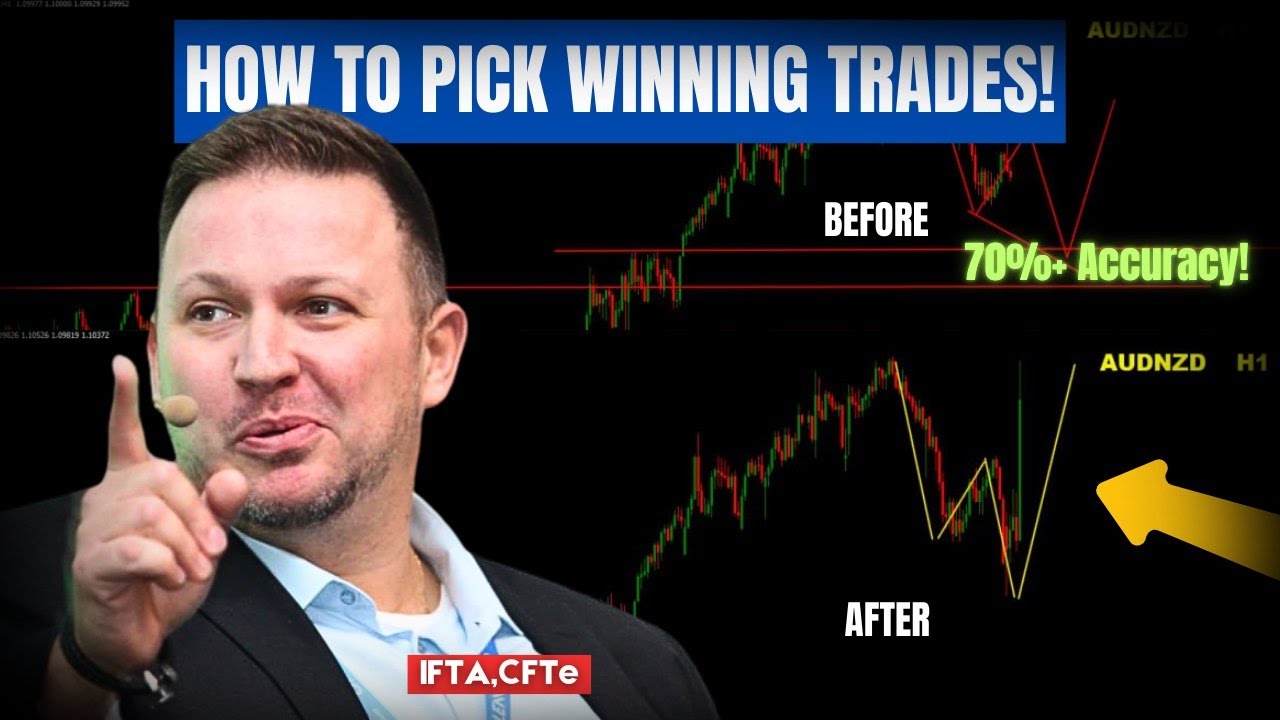
In this Home Trader Club video, Vladimir Ribakov explains the systematic approach he uses to achieve more than 70% win‑rate trades. After thanking sponsor 8K Broker, he walks through a real‑world Aussie‑Kiwi trade that was discussed in the club’s Telegram group, illustrating how he combines several technical concepts: supply/demand zones, support‑resistance levels, dynamic trendlines, Fibonacci extensions, and multi‑timeframe synchronization. He highlights the importance of higher‑timeframe context (daily and 4‑hour charts) to identify key levels, then drills down to 1‑hour charts to spot bearish and hidden divergences between price and the MACD/RSI. He explains how ABCD correction patterns and breakout entries are used to join the trend, and how risk‑reward ratios are calculated to keep the trade favorable. Throughout, he emphasizes that there are no secrets—just high‑probability setups, disciplined level analysis, and proper number‑crunching. The video ends with a call to join the Home Trader Club for live trading, courses, and mentorship.
Chapters
Hello traders, how are you? Vladimir here from Home Trader Club. In this video, I want to show you some of the techniques that helped me to pick my winners, my winning trades, with an accuracy of more than 70%, with absolutely fantastic risk-reward ratio. For over than a decade. But before we continue, big thanks and thumbs up to 8K Broker for supporting our amazing community. To enjoy all the offers we have with 8K Brokers, including the access to the Home Trader Club up to 1 year, my trading strategies, the indicators, private mentoring sessions, and the dedicated short-term or day trading group, please refer to the link below this video in the description. So to explain that techniques, how do I pick my trades, I want to take an example for a trade we discussed in our Telegram group. Home Trader Club Telegram group. So here is, as you can see on the screen, uh, the, the group where we have our communication, uh, and this was one of the ideas we discussed, uh, the Aussie Kiwi sell. So the plan was short-term sell and then a longer-term buy. The reason is, and that's what I will want to explain, is the short-term sell because there was a great probability for a retrace or a pullback in that case and for longer trend continuation. And that's exactly what I want to explain in this video. How did I pick them? So for that short, for the sell, and this is how we were looking to sell. That's what is per our discussion. We discussed it in our live session in Home Trader Club. Um, and the logic behind this sell was simple. Market will always look to react from level towards a level before the trend continuation. So what does that mean? We have supply and demand levels as key levels to watch. We have support resistances. We have dynamic support resistances like trend lines. We have Fibonacci extension levels, and we have multi-timeframe synchronization, which is also important. So Aussie Kiwi, if as if we start to look on the higher timeframes, so we understand the logic behind the sell here. This is the daily chart. There is a really no doubt that according to daily chart, we are at the moment moving towards. The upper part of this channel, tunnel we can say, right? But what happened there that we now came— what, not now, a couple of days ago here— we came to retest this peak. This peak is so important for a few reasons. We had a sequence of lower highs, lower lows starting from this zone. Then we got a low support which was broken, becomes a resistance, and then another low before the price comes to retest it. Well, this area is both a resistance and the supply zone, a zone where the sellers— let me just mark it to you here— a zone where the sellers show their interest. How do we know that? Look at all the spikes. All these candles, how many candles in a row you see upper spikes? I count like 1, 2, 3, 4, 5 candles in a row where the sellers, every time the buyer is trying to push, sellers resist and reject. Yeah, absolutely phenomenal zone, both resistance and supply where sellers take the control. Uh, if you want to have some better view on the price action understanding, the basic understanding for that, you can watch this video. Where is that? Here on the right side, uh, right now, uh, about the price section. Or I want to invite you also in our Home Trader Club. You have, once you join, in the education section we have full courses for beginners, advanced, full free courses also, and we have a dedicated Media Zone, tons of webinars covering all these terms and all these techniques in detail. So that was the reason why I chose this level for a short-term sell. Then on a 4-hour chart, when we dropped lower, I found, okay, we have some sequence to the upside now, right? And there are no signs at that point. As soon as we reach this zone, there are no signs it's over. So the logic says that, okay, the daily had the level we saw. And this is the area we can clearly see here also sellers, sellers, sellers, phenomenal zone. And all that happens to be in a place where the RSI was close to overbought. Then some develops on divergence. This is where we expect to see a correction exactly as we discussed. In our group, right? Expect the correction, make the move down, and from there look for the buys. So what happened then? Just skip, skipping to the place where we discussed our next one. Following the same idea, we started to see the move down, and it started to make these lower highs, lower lows. So the logic is simple: any pullback. and we are after further sell. And what happened with the Aussie-Kiwi— and this is our next follow-up— we got the first wave, we got the pullback, and expected to see final drop to the downside before the rally continues. Okay, and that actually happened right here as we completed the 2 waves towards the zone we wanted. And from then the rally. So why specifically this zone? Why the sell and why the further expectation? So why the sell? I explained before. The four-hour, the daily and the four-hour chart levels leave no no much room for imagination. Now the interesting part happened to be here on the one-hour chart. We saw bearish divergence: higher highs on the chart, lower highs on the MACD. And the recent trend line we saw there was broken to the downside. As it happens, we start to see lower lows on the chart and the indicators, which usually means we should see corrective structure, which is ABCD or 2 waves down or a range. That's why after the first leg, I expected to see another leg. Now, as I mentioned in the beginning of this video, market loves to move from level to level. So we spotted this level from the higher time frame. Now take a look on the key levels we have here on this time frame. Lots of consolidation and buyers, buyers, buyers, buyers, right? That's a strong zone. If it will be retested with bullish signs, there is a high probability for further continuation upside, which is again what happens with that case. Okay, so this is why I pick this zone as a target for the sell. So we got a phenomenal shot here on the short term, and then the idea was buy these dips. And here are several ways how to join these ways. So there is a strategy, uh, which you can see right now on the right top corner Explaining how to join the trends when it comes to ABCD correction. That's one way, but second way is hidden divergence, which is also— you can find this video directly right now, you can watch it on the right top corner. Hidden divergence is a sign where you got the trending conditions on a specific time frame, a pullback, and then for comparison you have higher lows on the price and lower lows on the indicator. Higher lows on the price, lower lows on indicator— complete an inverted or hidden divergence hinting for a trend continuation. So the logic here, once again, now after the pullback happened here, let's look to join this ongoing daily channel. Okay, that was the plan. So for the hidden divergence, there should be a verification step. Verification step is at the end of the correction, there should be bullish divergence, which means while the market makes lower lows, indicator will make higher lows. And then we got this ABCD breakout and all the rest is history. In that case, the trade— the risk-reward is in your favor Because that becomes the risk after the breakout. And according to higher time frame, there is further room to go, which means you now in a positive risk-reward ratio and the numbers start to work in your favor. Both in a sell where we spotted this reversal here, same thing, lower lows on the chart. Right? And here we are towards our zone we discussed. This is phenomenal risk-reward ratio. And then with the ABCD breakout, which we got here, again, risk-reward in your favor. So that's how you control the numbers to work in your favor. I really recommend watching this video to understand it better, how numbers, how controlling the numbers in your favor would help you. And that's the one or few of the techniques how I pick my winners with over than 70% probability for so many years, over a decade to be precise. Okay, there are no secrets in trading, absolutely no secrets. What there is is high probability Trading, which means find your level, find your setups, multi-timeframe synchronization, pick your setups, make the numbers work in your favor. Voilà! There will be good days, there will be bad days, but if you keep that going clean and clear, stable, consistent, you would see the numbers work in your favor. You would see huge surprise how well trading started to go. So I hope I managed to explain you the techniques, how do I pick it up. As you can see, it's a mix, but the logic here is straightforward: levels, multi-timeframe analysis, divergences, and breakouts when it comes to trendline or recent lows. That's pretty much it. And once again, I want to invite you to our Home Trader Club to our family and enjoy all our real-time trading opportunities we have, and of course our comprehensive courses, education in real time, and so much more. Thanks for watching. I wish you and yours all the very best. Don't hesitate to ask any question in the comment section, uh, below this video if you have any. I'm here for you, my team is here for you. All the best. See you soon with more good trading.