How To Spot a Bullish Harami Candlestick Pattern
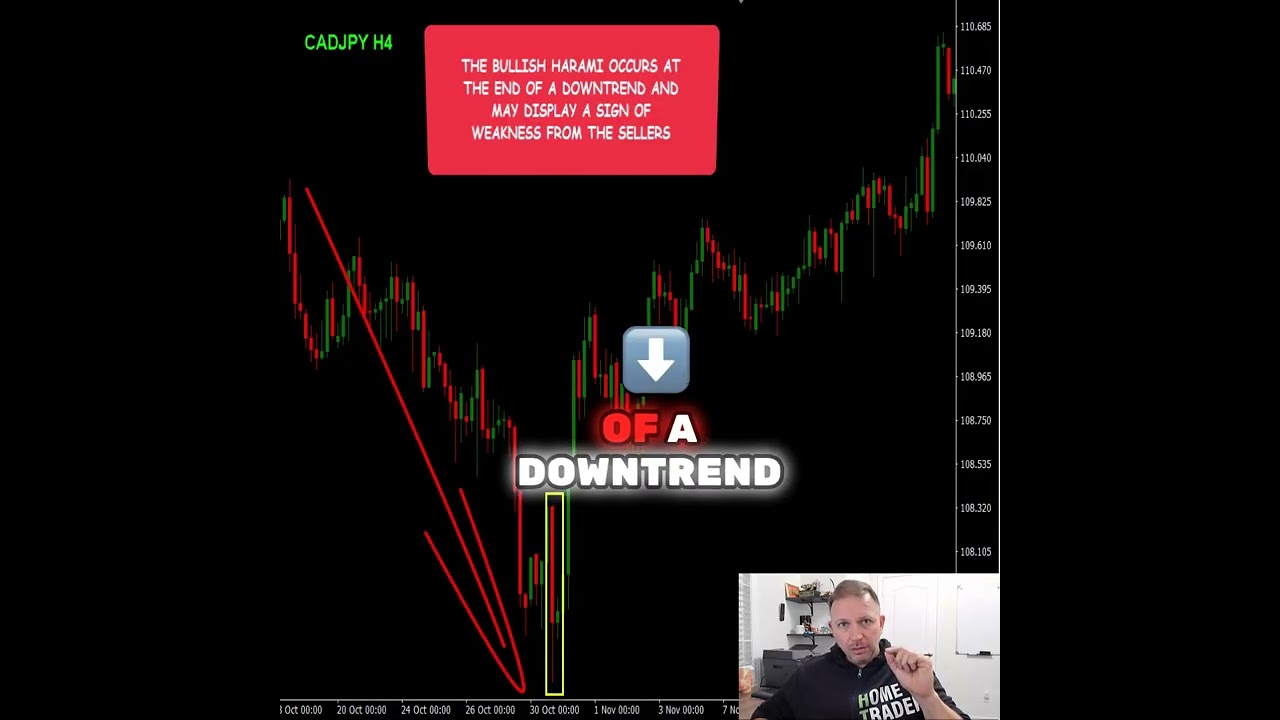
In this tutorial Vladimir Ribakov explains the bullish Harami candlestick pattern, a two‑candle reversal formation. He describes the visual criteria: a large red (bearish) candle followed by a smaller green (bullish) candle whose body and wicks are completely contained within the body and range of the preceding red candle. Ribakov emphasizes that the pattern must appear at the end of a downtrend, signaling that sellers are losing momentum and buyers may take control, making it an early reversal cue. He illustrates the concept with two chart examples – OZEN, where a strong bearish candle is followed by a contained green candle, and a GBP/CAD daily chart where a clear bullish Harami precedes a shift to upward price movement. The video’s purpose is to teach traders how to identify the pattern and understand its implication for potential trend changes.
Chapters
More from Vladimir






Stop Buying USDJPY: The Critical Resistance You Need To See #forex #tradingstrategy #shorts




