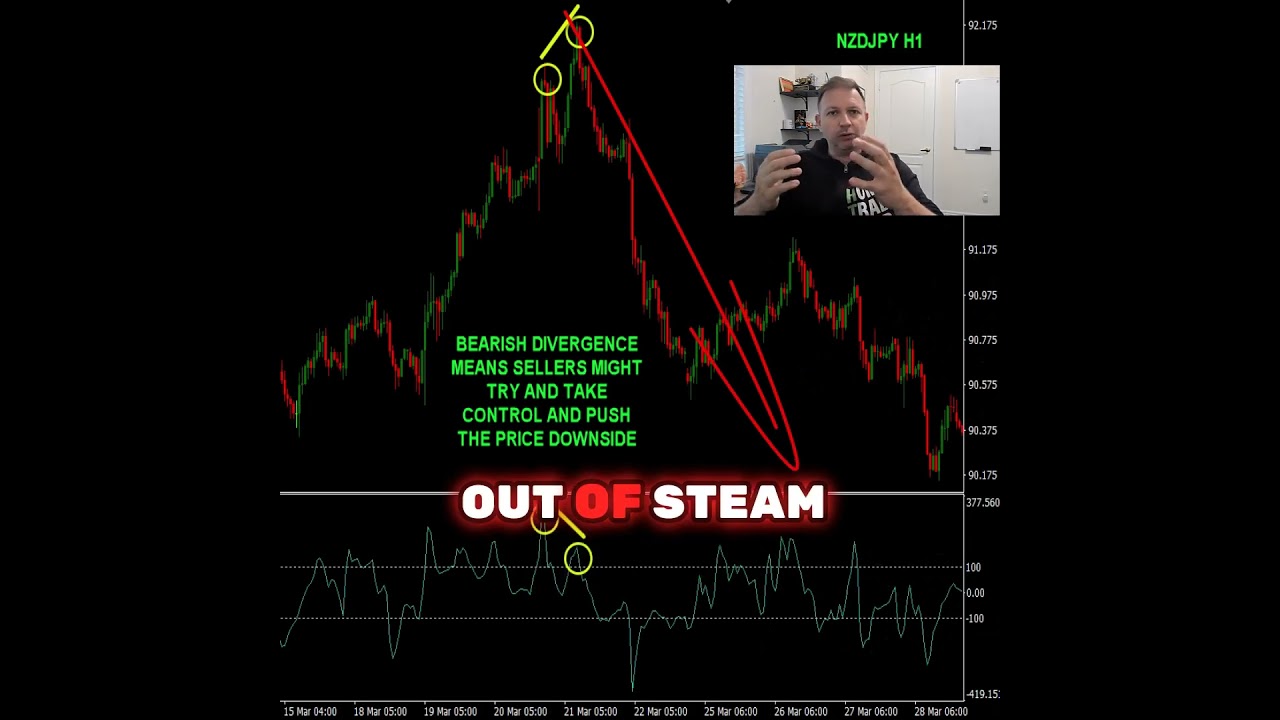
Vladimir Ribakov shows how to spot bearish divergence on the CCI indicator: when price makes higher highs but the CCI makes lower highs, momentum is weakening. The first CCI peak should be above 100, ideally above 150 for reliability. He demonstrates with EUR/AUD and USD/CAD charts.
Chapters
How to spot a bearish divergence using the CCI indicator. Step 1, find a clean bullish trend, meaning sequence of higher highs, higher lows. Step 2, compare the recent highs on the chart with the recent highs on the CCI indicator. You will want to make sure that at least the first high would be above 100. That's considered to be overbought conditions. Above 150 would give you even better accuracy. Bearish divergence means that buyers are running out of steam. They are losing their grip. Sellers might take the control. Here are a couple examples. EUR/AUD, clean bullish trend, higher highs, higher lows, countered by lower highs on the CCI at the end of the rally. First high above 100, bearish divergence complete by making lower highs on the CCI. Bears are coming in. USD/CAD daily chart, sequence of higher highs, higher lows to complete a bullish trend. Higher highs in the chart versus lower highs on the CCI while the first one is above 100. Bearish divergence— bears are coming in.