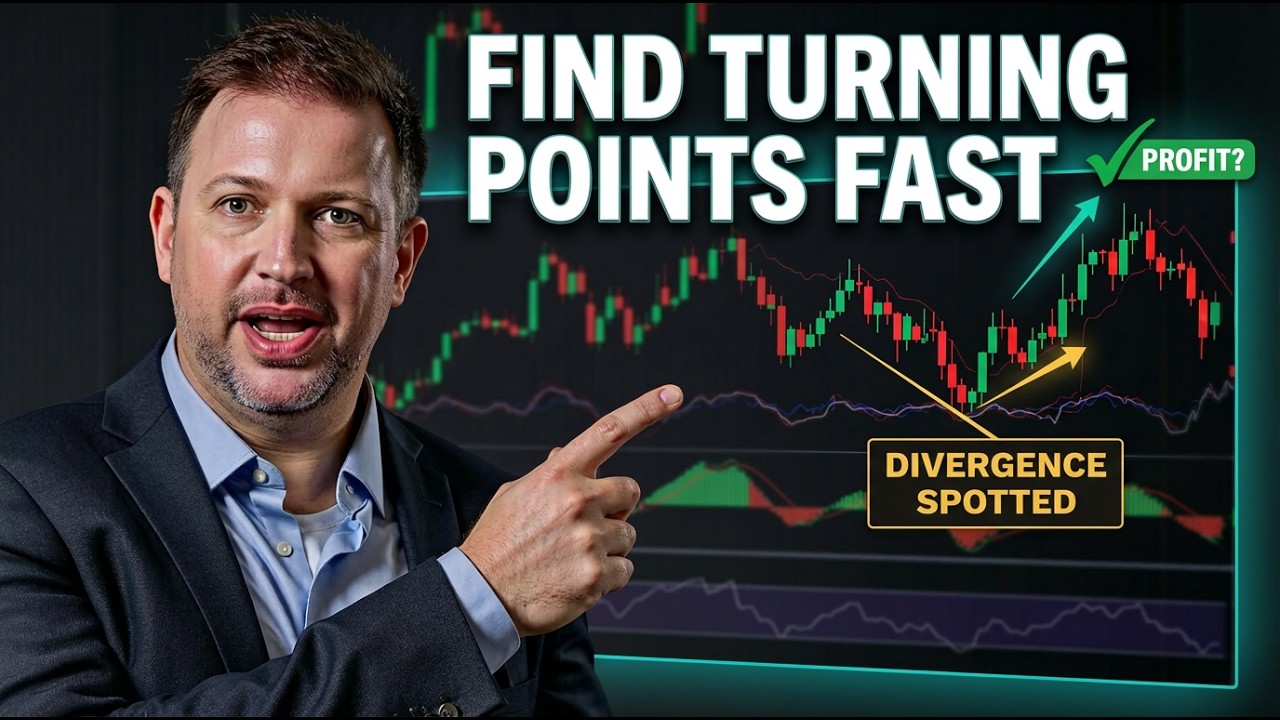
In this tutorial Vladimir Ribakov explains how to combine the Elder Force Index (EFI) and the Relative Strength Index (RSI) on the cTrader platform to spot divergences and generate precise trade entries. He begins by introducing the concept of using divergences as a "game‑changer" and outlines why cTrader is his preferred platform. Ribakov details the calculation of the EFI (price change multiplied by volume, smoothed with a 13‑period EMA) and the significance of its zero line, as well as the RSI’s typical overbought/oversold levels (70‑80 and 30‑20) and the 50 midpoint. He defines bullish and bearish divergences and walks through three practical scenarios: (1) a bullish divergence where both EFI and RSI show lower highs, followed by EFI crossing above zero and RSI moving above 50 (a “golden cross”) to signal a buy; (2) a bearish divergence where RSI diverges first, EFI lags, and a sell is taken after EFI crosses below zero and RSI falls below 50; (3) a situation where both indicators align, confirming entry and exit points. For each case he demonstrates how to set entry, stop‑loss (e.g., 70‑120 points), and target levels based on prior demand/supply zones, emphasizing positive risk‑reward ratios. Throughout, he stresses the need to confirm signals with price action and not rely solely on indicators. The video concludes with a call to join his Home Trader Club for further education and a standard YouTube engagement reminder.
Chapters
Elder Force Index, RSI— this combination could be your absolute game-changer in trading. What do I mean by a game-changer in trading? Spot a divergence, wait for the Elder Force Index to cross above specific levels, and boom, you have a golden trading opportunity. With the right money management and the right risk management, aiming to the demand levels and the supply levels, you have a golden gem in your hand that could deliver mind-blowing results. Let me show you how it's done properly. What's up, guys? Vladimir here from Home Trader Club. And in this video, I want to share with you a very powerful, from my point of view, also not complicated method of using the 2 kind of similar and yet very different technical indicators to spot divergences and precise entry. And I'm talking about the combination of Elder Force Index and RSI. Ready? Let's begin. So before the charts, this video is presented on the cTrader platform. Why cTrader? Here you can find a list of all the reasons why cTrader is a superior platform to many others. And if you missed all the previous videos I created on cTrader platform and about cTrader platform, make sure you watch this playlist. You can find there all the information you need and some very, very strong trading methods using the tools that cTrader platform has for you. So how these 2 indicators can come together? Each of them is a world by its own. Each of them has tons of information. I will explain both of them. And also the combination, how they are combined, how they should be combined in 2 very powerful ways. So first of all, the Elderforce Index. Those of you who do not know Dr. Alexander Elder is one of the, I would say, strongest, biggest, most popular names out there. I myself, when I started, I was reading his books and a lot of the knowledge I have about the divergences I have to give the credit to Dr. Alexander Elder. He has fantastic ebooks and books as well, of course. I myself have here behind it some books of his. So really worth reading. And a lot of the ideas behind his approaches towards the divergences and reversal points I got from him before I polished that. to my own style and my own personality. So one of the indicators in this very strategy I will be presenting is basically his, and he introduced it in his book. This is the Elder Force indicator and the Elder Force Index, of course. And this indicator works on a very, very interesting method. So there is a simple logic behind it. It takes the close of the current period And the close of the previous period, multiply that by the volume and smooth all that by applying exponential moving average, by default 13, on it. The result is here. Okay. This indicator comes to measure the price ranges as it changes with the, as the market develops and giving that on average to see how it is compared to the previous period. Where do you find this indicator on a cTrader platform? You go to the indicator section and you can just type it down here, Elder Force Index, and you would find it here. Now, by default, it doesn't come with the line. I add the level of 0 here simply because I love, like for RSI 50, for example, I love to see the crosses above and below The zero above the zero is considered to be current positive environment in the market. Below the zero, it is considered to be negative. On top of that, I add the RSI, the Relative Strength Indicator. Amazing indicator by its own. There are tons of usages for the RSI indicator, and you can watch here on my channel other videos where I talk about the RSI and different uses. This indicator has for traders. Before I continue, it's very important to mention indicators. I love them and they are amazing. They indicate. Price dictates. And you should never try to rely only on indicators. Combine it with price because price is where everything happens on. Okay? Lots of traders misjudge the importance of the price, rely too much on the indicators. Indicators, and I love indicators, they are great indications, but they are exactly as they are, indications. So how is these 2 indicators, how do these 2 indicators actually combine together? So I am a big fan of divergences. I mentioned before Dr. Elder and his approach towards the divergences. I have my own, a little bit twisted to my own needs and my own experience. Power of these 2 indicators is each of them in different variations and different calculations give very strong sign when a potential reversal comes after divergences. So if you have no clue what is divergence, you can find on my channel or right here on the top right corner a video talking about the divergences. And if you want to learn more about how I use the divergences with cycle, uh, in my different methods, I invite you to our trading family, the Home Trader Club. You will enjoy their full trading courses, Real-time education, real-time opportunities, so much more. So the link is just below this video in the description. So the idea of the divergence, and I will go blank screen just to give the basic information here. The idea here is when the market makes higher highs, but indicator makes lower highs at the same time, this is considered to be a bearish divergence. And a potential, I say potential, uh, because we don't know to predict, we have to follow the price, uh, reversal comes in play. And at the end of a bearish trend, when the market makes lower lows, but indicator makes higher lows, that is a sign for a bullish divergence and a potential reversal to the upside. So we take that. And we go to see how these 2 indicators are combined. And there are 2 few, not 2, very important moments here. So take a look how it will be found. So after the bullish momentum and the buyers and all that, after bullish trend where we have sequence of higher highs, higher lows, look for the conditions when the indicator especially the Elder Force indicator starts to basically present reversal signs by making lower highs. If the RSI does the same, beautiful. That's what you want to follow. If the RSI does not do the same, like in that case, pay attention to RSI to be overbought. When that happens, and that's overbought by default is above 70, I love to go a little bit more extreme with the level of 80. And you can see here RSI peaks at the 80 while the Elder Force indicator makes lower highs. RSI comes to the overbought. The next step you would want to see is when the Elder Force will cross below the zero. Why below the zero? Because below the zero is considered to be in the bearish environment, sentiment controlled by the sellers. And when that triggers, many times, by the way, at that point RSI also would go below 50 or follow below 50 few candles after, like happens, uh, several bars after. But this is your indication that now the sellers are likely in control, and that's your time to start looking for sell opportunities. And if you are looking for the sell opportunities around this zone, keep in mind that all that remains valid and relevant as long as the last peak would hold. And when you would be seeking for targets, always look for the next key lows on the play because that's where the buyers took control. These levels would be acting as demand levels and very legitimate targets. And the last thing you would need to measure, what kind of trade you have here. If your protection, for example, is about 120 points, you would want to make sure that your targets, the first one, has at least the same amount of points, ideally bigger, to maintain a positive risk-reward ratio that will make the numbers work in your favor. So this is the first usage of this indicator. The second one I want to show the scenario where it actually is inverted, when RSI has a divergence, but the Elder Force Index does not. So where does that happen? For example, when you see conditions like that, 3 lower highs or more, which stands for a bearish trend, and then you compare the lows on the chart, you can see that the RSI already has higher lows, right? You compare these lows and you find that RSI has higher lows. But when you take a look on the Elder Force Index, what do you get? Lower lows. That's usually a sign that the market might not be ideally prepared for that, and you should wait for better signs. Indeed, what you can see the market is doing is creating some sort of a double bottom after that, and look what happens right after This drop. The lows now start to be aligned with the RSI that gave the signal before and make higher lows right now. So RSI gave the sign before, now they both are aligned. And at that point, look where the cross above the zero line happens. And the cross happens in that case, I called it a golden cross, just for me, a golden cross, when after divergence, the RSI goes above 50 and Elder goes above the zero. When that happens, you will want to look for your buy opportunities. So if that's where you consider to go for the buy, make sure that your target where you would want to aim the next important high, which is the zone of the buyers here. Here, that's a very important level, of course. And the reason, by the way, I do consider this zone is because if you take a look, this level was a resistance level in the previous run. So this is an important zone. You can see here it rejected. So this is an important zone, a legitimate target. So when you would be looking for a trade, make sure that if your protection is about 70 points, then your target is going to be at least 70 points, ideally, but bigger. Because it is important for your risk-reward management and to maintain the positive number in your trades. And with that in mind, this is how you make numbers work for you. And the third final combination is when they both actually say the same. I could start with this scenario because this is the most default one, but I wanted to show you 2 not so common, not so popular conditions because it's important to know what to do in the not so common conditions, not less important than what to do in the common conditions. So when the market completes a bullish run by making higher highs, higher lows, and you have the condition where the RSI Has bearish divergence, and also the peaks here and the peaks here have the divergence. That means you are in the bearish momentum right here. These are the peaks, and that's the bigger scale. Of course, this is the combination when they both become aligned, and when the Elder Force indicator go below the the zero. This is your sign that something happens. RSI below 50 would give great sign and it happens several bars after that and that gives even better verification when they both aligned. RSI below the 50 in the negative zone right now and the Elder Force Index below the 0 in its own negative zone. This is a great sign. So when you are looking for the sells there, you have to ask yourself, okay, so if this is my protection and this could be the target, there will be no good risk reward to here. So that doesn't make sense to enter at that point. Either you enter with retraces because when you enter with retraces, you improve the risk reward ratio or you aim for a next key zone here. And then we have one here and then here. These levels as target levels. Okay, but very important thing to, and you can see what happens after that. Besides these target, the next ones did not reach. So it is important to pay attention to the price. And what do I mean by that? Look what happens at that point actually when the RSI makes. It's higher lows and when higher lows as well. You can see here and here. Basically, you have the lower lows on the chart, higher lows on the indicators to indicate a bullish divergence. And when the bullish divergence happens around your target zone, that means cash out. I didn't draw well. Cash out. That's it. So these are the combination The most popular combinations of the Elderforce Index indicator with the RSI. Again, I'm a big fan of the divergences. Why? I can talk about it for hours. Watch this video here, my story, and you will understand how I ended up trading in my style and what I went through in my trading life. Thanks for watching. If you have any questions, don't hesitate to ask in the comment section. And I would like to thank you for your time watching this video. As always, I hope you find value in watching these kind of videos. If you do, please hit the like button and subscribe to our channel so you can enjoy other videos we upload for you as well. And I want to invite you to our trading family, the Home Trader Club. Get your access to our full courses, real-time education, and real-time opportunities shared with you in our dedicated groups. That's it for this video. I wish you all the very best. Thanks for watching, and I'll see you soon with more. Good trading. Bye for now.