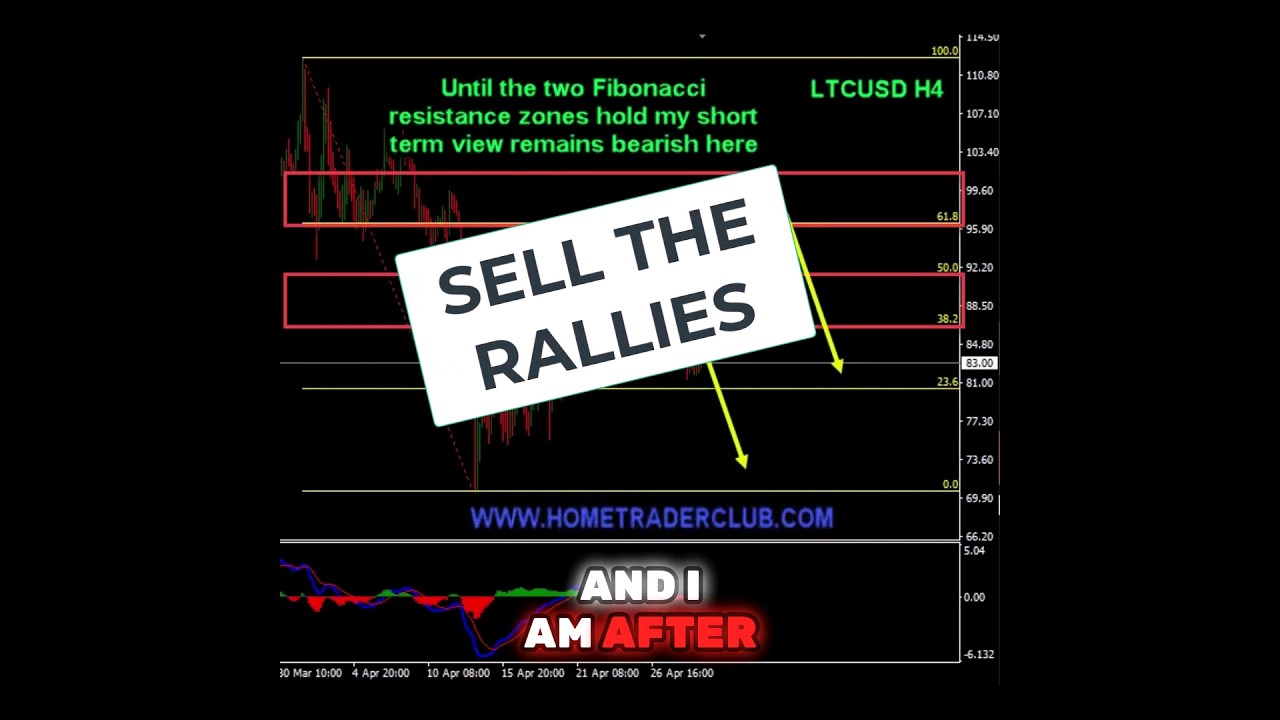
Vladimir Ribakov identifies a sell setup in Litecoin after the daily chart broke below a rising trendline and formed lower highs and lower lows on both price and MACD. Fibonacci retracement levels mark two resistance zones that could confirm the bearish move.
Chapters
Is it time to sell Litecoin? Let's take a look on the charts. Daily chart broke below the rising supportive line or rising trend line, and while doing so, the daily chart flipped the price action structure from higher highs on the chart versus lower highs on the MACD, completing bearish divergence. We now have lower lows on the chart supported by lower lows on the histogram of the MACD. Making a bearish conversion. 4-hour chart also synchronized with the daily chart, making lower lows on both the price and the indicator. If we plot Fibonacci retracement on this bearish move, we can see that these 2 resistance zones are key zones, and as long as they hold, my view is bearish and I am after sell. Join Home Trader Club for complete trading courses, real-time trading education, and real-time trading opportunities.