MACD Divergence + CHoCH Trading Strategy | Catch Reversals Earlier
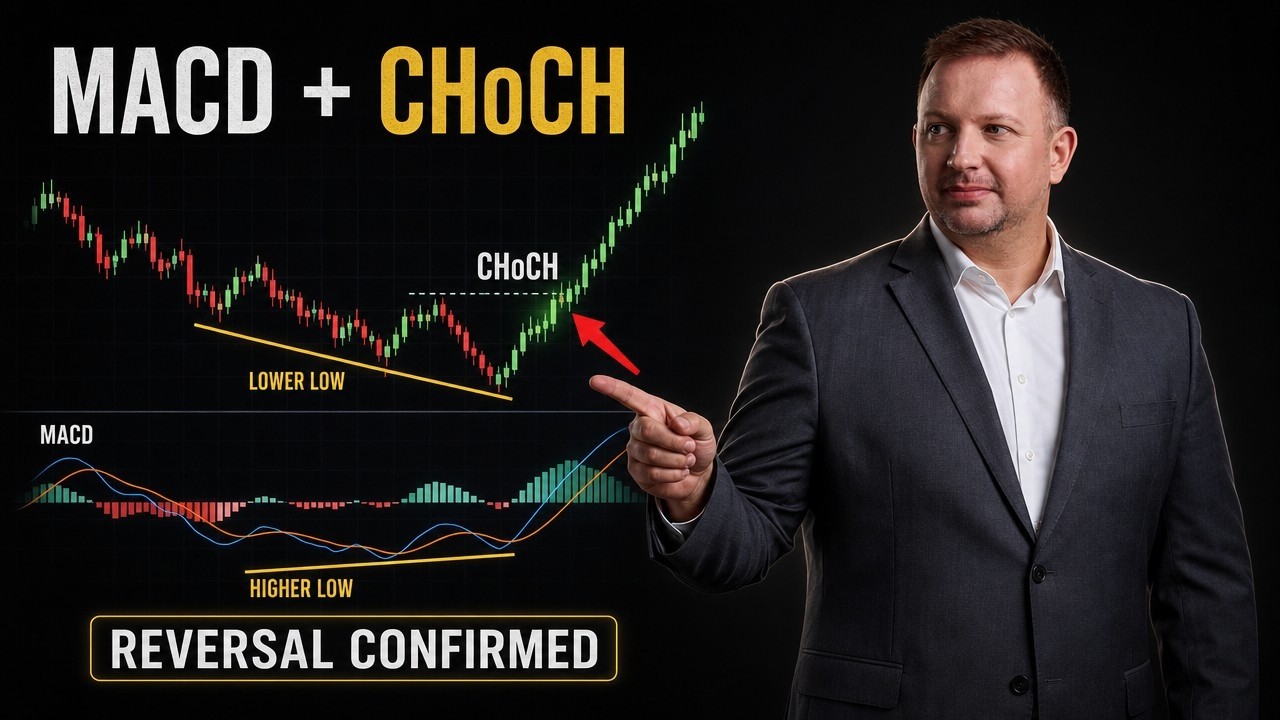
Vladimir Ribakov combines MACD divergence with Change of Character (CHoCH) analysis across multiple timeframes to catch trend reversals earlier. Divergence is a warning signal, not a trade trigger. The method claims to raise success probability from 50% to 70-80% when paired with strict risk management and a 1:1.75 risk-reward ratio.
Chapters
Most traders trade the MACD divergence absolutely early. They see divergence, they jump in a trade hoping for good. But a big mistake here that they do is skipping the understanding, or misunderstanding sometimes, that divergence is indication. It's a warning sign. It happens on indicator, and indicators indicate. And this is where the understanding of the price action is so critical. While divergence gives you the warning, the price can still move in that— divergence does not make the market move differently. It's a warning that something builds up. So this is why I love to combine the divergence with change of characters and convergence setups, which I'll be showing here today in this very video. And by the end of the video, I promise you will understand the full flow of actions— what to do, how to spot, how to prepare a trade, how to execute a trade, and how to make it work for you and make you profitable trader. But before the charts and the trade examples and the steps, what to do right, who am I? Why should you listen to this video very, very carefully? My name is Vladimir from Home Trader Club. I'm internationally certified financial technician with over 2 decades of experience. Since 2006, I'm in this industry, been working for brokers, been trading for nostro companies, been trading for myself for more than a decade. Successfully. So I know a thing or two. So what you will see here today could actually help you in your trading if you executed it properly. So you will see the exact flow I love to follow when it comes to divergence on the MACD, when it comes to change of characters, and the combination between the two. And in this video, if you are interested, of course you can listen To my story, all the struggles, all the history, all the failures I went through to be in a place where I am today. So here is a video for you to watch. But before we go to the charts, let's talk about the very very basic. What is this change of character, or as it's known, the charge? This is a subject you can find so much material about it online, but unfortunately most of it would be not complete material and sometimes even misleading material. So I want to very carefully explain what it is, how you. You can combine that with divergences found on the MACD and improve your probability in trading. So first thing first, we should identify uptrend or downtrend. So when the market goes in an uptrend, it creates a sequence of higher highs, higher lows, as simple as that. And as soon as we break the last higher low and make lower low, this is a change of character. Does that guarantee the change of trend? No. Does that guarantee a winning trade? Of course not. But it gives you a great sign that the trend might be changing. And with combination of few different things which I'll be showing in this video, you can increase your probability, find great setups. So this is the very basics of the change of trend. Okay, this is a sign that something might be changing. How does that look like when it comes to a downtrend? So at the end of a downtrend, it would look pretty much similar, but it— the market will create lower highs, lower lows, like you can see on this example. And then by the break above the last high, this is the change of character. Once again, does that guarantee an uptrend from here? No. Does that guarantee a winning trade? No. In combination with the other things that you will see in this video, you would have increased probabilities to find successful setups. And keep in mind, in trading, all you need is increased probabilities. You will never find a guarantee or warranty for a trade. But when it comes to trading with increased probability, with the right risk management and the right risk-reward ratio, you will have the edge. And as I promised before, watch by the end of the video, you will understand the full flow and all the steps taken and that should be done if you want to find these very high probability setups. And to present all that and explain that, I will be showing you an example that we did in Home Trader Club, and I will be explaining all these exact levels, how we spot the opportunity, how we defined the sell zone, and how do we— what do we look inside the sell zone for actually in order to execute the trade? And at the end of this video, this is exactly what you will understand: how to spot all the steps, the bearish divergence, the change of character, how to find and define the level, and how to make your trade, and how to make them with high probability to pay you well. And I would also would like to take the opportunity and to remind you, or to let you know, if you watch our channel for the first time, that we partnered with one of the leading brokers in our industry, AvaTrade, which means for you that if you trade with AvaTrade, you can get unlimited access to our club, the Home Trader Club, and enjoy of all of our real-time trades, real-time trading education, enjoy access to our complete trading courses complete section of videos and most comprehensive media zone that will help you to understand all the concepts deeply and trade successfully. So once again, if you trade with AvaTrade— and if you don't, follow the link below this video in the description, get your account, get your unlimited access to Home Trader Club, and also enjoy your access to our unique Trade Copier project. All the information is in the link below this video in the description. So let's break it down. How do we actually get it done? So this is the trade that I presented before, a EUR/CAD. This is the one right here, as you can see on the screen. Now let's talk about all the reasons. So here is what we found. We started with the 4-hour chart, and the multi-timeframe usage is one of my favorite styles of analyzing and then spotting the opportunities. So what I see on the 4-hour chart is a strong resistance, and while the market holds these levels, MACD is making lower highs. This is a sign of a bearish divergence. What I follow next, I'm looking for the change of character. And then if I go to the 1-hour chart, look at that. This was an uptrend sequence of higher highs, higher lows. Between the recent highs, we got what? A bearish divergence. Why? Higher highs on the chart, lower highs on the MACD. If you are absolutely new to the world of divergences, watch this video. It will help you to understand the basic concept. And also, once again, I want to invite you to Home Trader Club where you will be able to learn all these concepts in depth. So what You have to do is just to follow the link below this video in the description. So once we found these conditions, we are waiting for the recent low to be broken as this is the last high. Then you are looking for lower lows on the chart, and here is a trick: I love to combine that also with lower lows on the MACD. Now to be fair, there is one indicator that we created, the Fallsberg Convergence Indicator. As you can see on this screen, it helps me to spot. The false breakout when they happen, right, like here. And it helps me to spot the change of characters or full convergence conditions when the market makes lower lows on the chart and the MACD. When these conditions happen, for me this is a sign that something good is building up and the real opportunities will build up for me. So you can also of course get this indicator included in your all-inclusive membership with Home Trader Club, or if you trade with AvaTrade, as I mentioned before, you get your access to all of that. So going back on the 1-hour chart on the EuroCAD, once it happened, we got double the time frames that flipped. This was the break of the low on the 4-hour chart. This was the break of the low on the 1-hour chart. So now I want to break down the waves and find the perfect zone to look to trade. And this is where it is getting interesting. On the 1-hour chart, the market was making a sequence of lower highs, lower lows, which is a great sign that what— the bears are likely stepping in. What are the important levels we need to pay attention to? Broken support acts as a resistance, and last high that acts as the supply. So as soon as we get in, that's where I would be looking for that trade to give me the sign and attack it. Okay, so first of all, once again, I identify the divergence. I wait for that change of characters, multi-timeframe, better confirmation. I go to the lower timeframe to spot the waves and make sure the bears are stepping in. And this is done by confirming a sequence of lower highs, lower lows. The next step is to identify the key level. In our case, this was the 1-hour chart. The broken support acts as resistance. Also, this mini range here, of course, acts as a strong supply area, and it is included inside. And the high that acts as the last height and the last supply where the sellers took control from— this is my action zone. I want the price in, and that's where I will looking for the sell opportunity. And Look to attack. And now let's talk about the important thing. What are the steps then to attack? So once the price is inside, like we identified in that case, once again, as I said, this was the range included. This is the last low that broken support and resistance and high as supply. Once the price goes inside, that's where I look to trade it. Let's go back to the official chart. Which is here. And once we are there, what I want to do is to follow first of all that candles change, the bars change. Think about it this way: if you confirm the lower highs, lower lows, and the swings with pullback, you're looking to sell. Do the same with candles. From higher highs, higher lows, look for candles that make lower highs, lower lows. Or in our case, it happens right here. This is a great indication that still sellers are very likely stepping in again and increase your probability to find the sell that you are looking for. And if you want a little bit more advanced, watch for the same change of characters on even one lower time frame. So this is the 1-hour for us, and if we go to the lower time frame like the 15 minutes Here is what we will be able to find: fake high. Look at that— higher highs on the chart, lower highs on the MACD. This is step 1, divergence. Then you want lower lows. This is step 2. Why do they do it this way? Step 2, uh, which is the change of character. Step 3 is this pullback to happen, and you are stuck. Your trade. So this is how you actually find your entry. You can, of course, after you identify the zone, you can wait for these candles to start flipping. Or if you wanted a little more advanced, go to lower time frames and look for this change of characters. Once that happened, you would want to protect above your trading zone. In our case, this is the high of the supply, so I would want to protect this area. And why it's so important? Because If I would be attacking, for example, after these falling candles which make the lower highs, lower lows, and my protection is here, I would need to make sure that I have a good risk-reward ratio that will make the numbers work for me. At the end of the day, it's all about the numbers, not the perfect setup which so many traders fail to find. Which so many traders believe that happens after the indicator gives some tick or something. That's not always the case, and most precisely to say, it's not the case most of the times, not sometimes. So what you would want is the numbers to work for you. And if that's the case for me, if this is my protection— once again, let me redraw that for you— if this is my entry and this is my protection, I would be aiming to the zone where there are the last Key supportive areas, or where there is a strong zone from the higher time frame. If I go to the image of the trade I showed you before, and this is my perfect zone right here, okay? And this is where I aim. So if this is my attack and this is my protection, I need to make sure I have good risk-reward ratio. If this is my X, you can clearly see that the profits is much. Bigger. Let's go back to the chart and take a look on the in terms of the numbers. So this is my protection about 3840 points. Target zone is more than 70, which means I have a very positive risk reward ratio. And even if I will need to manage the trade earlier, and I will explain in a moment what does that mean, I will still have a good risk reward ratio. So what does it mean to manage my trade earlier? If the divergence was the first sign to indicate me to get ready for a trade, divergence would be the first sign to indicate me to get out of the trade. And if I will have opposite sign, lower lows on the chart and higher lows on the MACD moving averages, of course you can use RSI divergences as well. This would be my sign to say aha and look to realize my profit. And in that case, because the initial risk-reward ratio was very positive, Remember, about 40 points as protection versus 70 plus as the profit. And if I would be cashing out when the opposite divergence against me, I would still be in positive risk-reward ratio, which means even if I will work with as low as 50% accuracy, I would still be generating great profits. But believe it or not, when you follow this concept of the divergence on the MACD with change of characters, correctly and properly as I taught on this video, you would increase your probability not for 50% but to 70%, up to 80% in times, which gives you the absolute edge in your trading. That's pretty much it for this video. And as I promised, by the end of this video, which I hope you made it, and congratulations if you actually did, you would understand the steps and the flow I do. Which I want quickly to repeat that divergence to be found is step number 1, ideally in multi-timeframe. Like in my example was 4-hour and the 1-hour change of character. Again, ideally on 2 timeframes, but even one is enough. And once you get the change of characters, let the price to pull back, predefine the key levels— broken support that becomes resistance, highs as supplies— and this is your zone to look for price rejection. Once the price gets in, look for the candles that form and give you this very sign that sellers are stepping in the game. And/or look for the change of character on the lower time frame. This would give you even better price opportunity. Like in our case, this was the 15 minutes. Here, look at the chart. 15 minutes breakout, right? So you would want to protect this high, not even above the 1-hour chart high, which will even improve your risk-reward ratio in many cases. And then of course, manage your trade. Set your take profit on the next key level— support, resistance, demand levels— and make sure you get out if there is a divergence against you before the target was reached. You follow these steps, you will have the absolute edge in your trading. So that's pretty much it for this video, and I want to take the opportunity again to thank you for watching this video. I want to remind you once again, you can download our indicators, our ebooks, with the link below this video in the description. And of course, you can get absolutely everything, unlimited access, with our special deal with AvaTrade. The link to that is below this video in the description. Thank you very much for watching. If you have any questions, don't hesitate to ask in the section below. I wish you good trading, and I'll see you soon with more. Bye for now. Good trading.
More from Vladimir






Stop Buying USDJPY: The Critical Resistance You Need To See #forex #tradingstrategy #shorts




