MACD Divergence Trading Tutorial
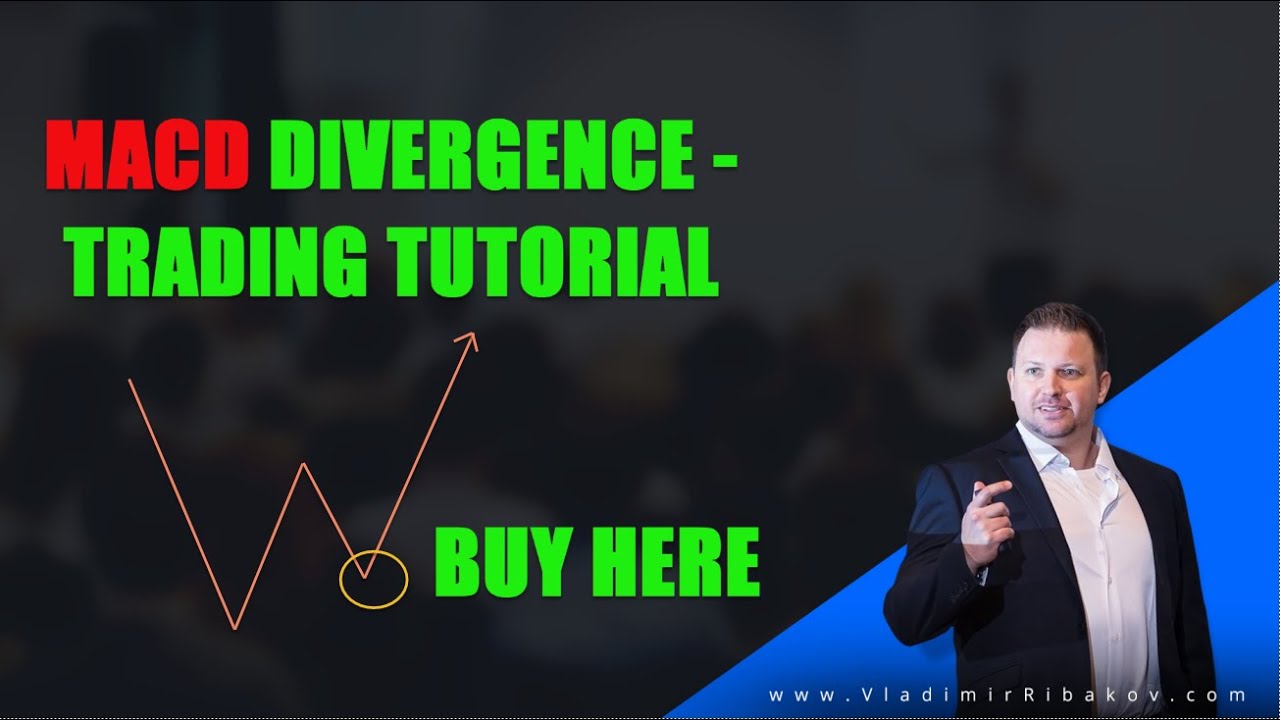
Vladimir Ribakov shows how to trade MACD divergence by confirming signals across multiple timeframes, then entering on price dips with stops above previous lows. He walks through a live AUD/CHF trade, stressing that price structure matters more than the indicator itself.
Chapters
Hello traders, how are you? Vladimir here from Traders Academy Club, and in this video I would like to share with you how to work with, how to trade with MACD divergence and the price action or price reaction after divergence, and to explain the trading technique I would like to take a trade directly from Traders Academy Club. This is our trading journal and this is where we track record every single trading idea and trading opportunity we find. And I would be explaining on this one, on Aussie franc, which we can find here. So before we do that, and I would like to explain everything on the chart, if you are new to this channel, welcome to our amazing community. Please subscribe with the subscribe button below this video, uh, and also invite you to our trading family, Traders Academy Club, where you get your access to the full VIP price action trading course where you will enjoy all the real-time trading opportunities and real-time trading education. Every single trading opportunity comes with a detailed video explaining the trading techniques. This is the best place for you to learn all my trading techniques as they are applied, as they are found in every single trading opportunity real time. Join us with the link below in the description. And now let's go to the chart. So why did we decide to go bullish here and why the idea was the pullbacks and further buys with this specific invalidation zone? So to answer these questions, let's go to the Real chart, and also I'll go for blank screen to explain the logic. What is a divergence first of all, and why does that happen? So in in this case, it was a downtrend where we got a sequence of lower highs, lower lows. Divergence happens when the latest pushes to the downside of the trend. Are running with a low volume, with, with less and less and less sellers, and it will look like that. So while the market is making lower lows, you would start to see higher lows on the chart— on the indicator, sorry. Now this is a very important thing to scream it loud. Does that mean buy instantly? The answer is no. And the reason for that is because indicator's job is to indicate. The price is the one that should dictate. And with that being said, what you will need to pay attention to are a few things. One, multi-timeframe to spot specific trading levels. And second is synchronization among the multi-timeframe you work with. Third key level for price to react. In that case, you want— it's a bullish divergence because the indicator indicates higher lows. So we expect the buyers to take the control instead of the sellers. And as a bullish price reaction, think about it logically. What happens when the buyers take the control? they start to create higher highs and then sequence of higher lows, right? So that's what you will want on the lower time frame for the price reaction. Okay, so going back to the chart, I'll go off the blank screen. Going back to the chart, this was the multi-time frame analysis. And also I would like to remind you, or to say it for the first time if you watch us for the first time, these indicators that you see on my chart, the volume, which also would be part of what I will explain, the volume profile indicator that also indicates here with key trading levels, and my virtual trading pen are available for you for free. You can go below this video in the description, uh, and find the links there for the virtual trading pen and the KTL indicator, the key trading level indicators. Download Install, enjoy. So the way I saw that was the daily chart was creating bullish structure after also changing the trend, right? It was a massive trend to the downside. Then we had higher highs, and as per the trend, we got bullish trend. 3 higher highs, higher lows. Afterwards, we received a beautiful corrective movement into waves here, right? Now the interesting part is we are going back to this square. A lot of volume building up here. And look at the volume indicator. Bam! Amazing volume indicator. You can see this histogram. It's a massive, massive, massive volume there. Once again, download this indicator. It will be tremendous help to your trading regardless the techniques you work with. Below this video in the description, you can find the link to that KTL indicator. Okay, now this was my daily analysis. So we got 2 waves Here with a bullish histogram divergence. Note how it happens: lower lows on the chart, higher lows on the indicator. It starts with a daily chart, then we go to the 4-hour, the next in the sequence. And look what happens here on the 4-hour. Look at that— lower lows on the chart at the end of the ongoing wave to the downside, right? And the interesting part, look what happens here with the histogram flipping, right? Lower lows on the chart, but Higher lows on the histogram, higher lows on the moving average of the MACD. RSI also joins the party by making higher lows by itself. And this is the moment where it's aha! That's the aha moment. And when we flip the trend, that's the idea. Look at that false breakout making lower fake fake lower low. One more false breakout. So this is if the price changes and flips to the upside. Buy the dips is the plan, right? And this is exactly why, as I presented to you directly in our trading journal, the idea here— once we flip, look what happens here. This is the flip. Buy the dips is the plan. Okay, so as it happens, look what happens next. Let me just show it to you so you can see that. Okay, as it happens, here is the 1-hour chart. Look at that. Boom, boom, boom. We go above the 4-hour chart high, right? Making the run upside. It was the— that was the bigger waves. Before that, it was all the way— you can see it, right, as it develops here with a pullback. And now look at once again, we are above the 4-hour chart high. Very, very important where the daily bullish 4-hour makes higher highs and the trending, trending structure changes to the upside. Okay, and we got a bullish hidden divergence because this is a trend continuation divergence. Okay, higher lows on the chart, lower lows on the indicator indicating the potential further bullish continuation. All the rest is history. Now why specifically Do I want to protect this area? Okay, because if you think about it, a bullish trend is what, especially if it comes after the flip, right? When we flip, we make higher highs, then we want to see higher lows. In that case, we do not want to go before the previous lows, as the sellers were creating the previous lows, right, of the downtrend. We don't want to go below that, right? And as we start to have higher highs, then higher lows, Right? I don't want to see these lows being broken because if they will, my analysis is wrong, right? And the buyers are not in the play. I would not want to be involved in this one, right? Or if I will be in it, I would want to cut out. I don't want to stay in the wrong side of trading in that case, right? So this is why I protect this way. And as you can see here, right, as soon as we flip Okay, this is the low and this is the low of the previous trend. So this high would still need to be cleaned, of course, but this is the low that starts to be very significant here and here. Key zone for us. Okay, and that's why as we flip, I want to pay attention to this area and say, aha, I don't want the price to go below that, right? Because if it does, then it's just a pullback. And if we go below that, that means the trend continues low. This is why I, I have to be very, very precise here. And in terms of the definition of my, uh, targets, so the next swing highs would— because think about it, that's the next swing highs are what? Are the levels where the buyers, right, lost the control to the sellers previous time. So this is the area and this is the area, right? So as we get there, that would be the place where I set my Profit, and as we go, as you can see, reached exactly these highs right right before the market decides to flip and to change its trend again. So this is the very important thing here: multi time frame divergence price flips. The entry in that case was a hidden divergence, which by the way. Below in the description you can also find the link to download my ebooks, and one of these ebooks is talking about the hidden divergence, okay, in very deep. So below this video in the description you can also find the download, the ebooks download link in the blog. Enjoy, it's there for you. So I hope I managed to explain the idea here of the multi-timeframe divergence and how does that look like on MACD. How does the basic divergence of trend change look like? And how does the hidden divergence for trend continuation look like? So you can take that, apply that to your techniques. And remember, you cannot blindly rely on indicators. Indicators are amazing, but the indicators indicate. You have the price to dictate. Highs and lows and trending structures tell you the whole story. If you find this video useful and helpful, Hit this like button below this video. If you have any questions, I'm there for you in the comment section, uh, and feel free to share it with anyone who you believe can benefit watching that. And once again, I would like to take the opportunity and to invite you to our trading family, Traders Academy Club, where you will enjoy the VIP price action course and all our real-time trading ideas and real-time trading education explaining the techniques step by step Why, how, and when on every single trading idea with every single video dedicated to the trading ideas. Join us with the link below in the description. And thank you for your time watching this video. I hope you find it useful and helpful, and I hope it will help in your trading. I wish you all the best to you and yours. Thanks for your time. I'll see you soon with more. Adios.
More from Vladimir






Stop Buying USDJPY: The Critical Resistance You Need To See #forex #tradingstrategy #shorts




