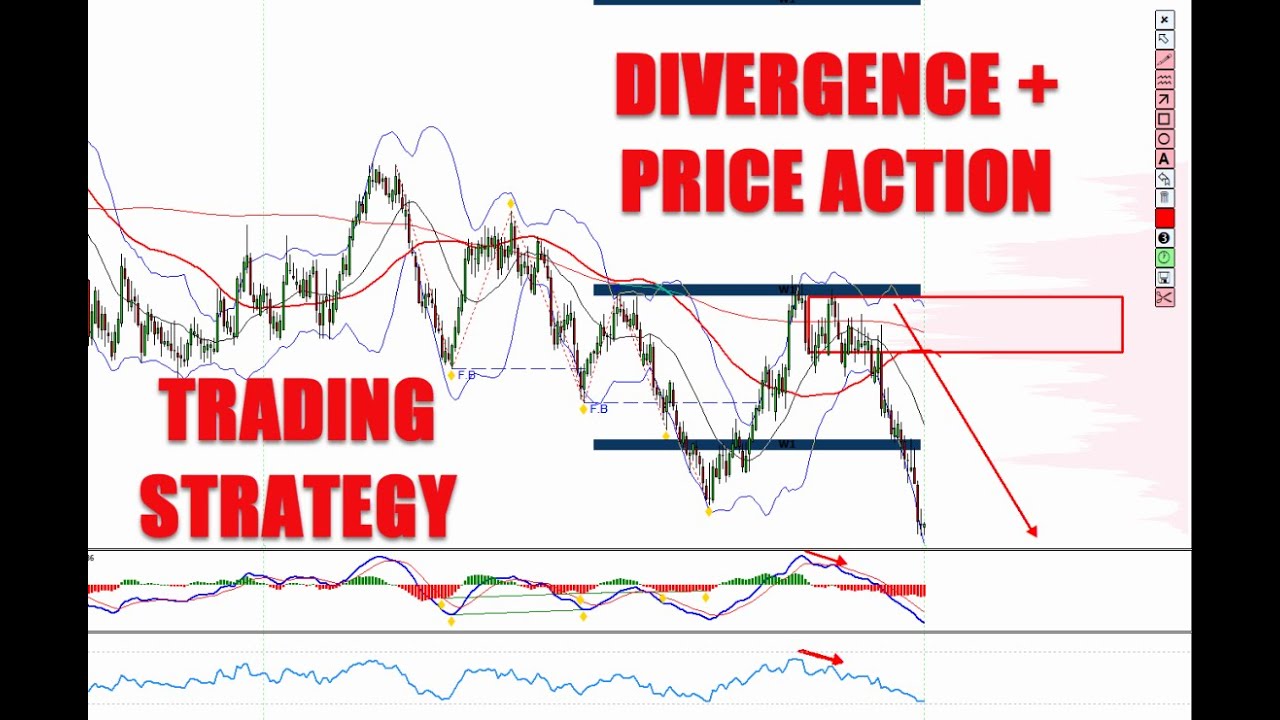
Vladimir Ribakov shows a Forex trade on Kiwi/CAD using price action, volume-profile zones, and divergence signals on MACD and RSI. He scans from weekly downtrends to lower timeframes, spots bearish divergences at pullback zones, and places stops at previous swing lows.
Chapters
Hello traders, how are you? Vladimir here from Traders Academy Club, and in this video I would like to share with you a very, very, very powerful combination of price action, volume profile, and divergences. To present my technique here, I would take a trade directly from Traders Academy Club. But before I go to the charts and explain the whole technique behind it, if you are new to this channel, welcome to our fantastic community. Please subscribe with the subscribe button below the video and remember to enable the notification. And also, I invite you to our trading family, Traders Academy Club, where you will enjoy from the full VIP price action course, real-time trading ideas, real-time trading education, every single trading idea Comes with a detailed video explaining all the techniques behind it, and of course you would enjoy from trading journal track recording all the ideas in one place as you would see in a second, and endless support from myself, my team, and our community. Join our family with the link below in the description or in the pinned comment in the messages. in the comment section. So to, as I said, to present the idea and the technique here, I would like to go directly to the trading journal. This is our trading journal where we track record every single step we do, and I would like to take this trade, the Kiwi/CAD, and to explain what stands behind this logic. But I do have one request to you. If you find this video useful, helpful, please feel free to share it with anyone who you believe can benefit watching that. And also hit this little like button below the video and drop some feedback in the comment section. Your help is very much appreciated, and thank you very much in advance to all those of you who take the time to, to help. So what do we have here? A combination of price action, volume profile based levels, and the divergence. And great news, this indicator that you see on the chart, this very indicator, Key Trading Levels based on Volume Profile, is available for you absolutely free. Follow the link below in the description, go to KTL indicator, Key Trading Level indicator, uh, follow the link there, download it, install it, enjoy that. As for now, it's for MT4. Uh, in the future, it also would be for MT5. Very likely. So I hope you will love it at least as I do. This indicator goes with me with any single strategy I apply, including the technique I would show today. So what do we have here on the multi-timeframe analysis? Multi-timeframe scan starting from the weekly timeframe. We can clearly see a channel, bearish channel, lower highs, lower lows, sequence of highs and lows in the same direction. Now check these out. Look at this massive volume building up on the weekly time frame. Absolutely powerful rejection zone. Once the price bounces off the bottom here back to the upper part of the channel, taking that into consideration, we go to the lower time frame. And this was our tunnel we were talking about. Right, and here we are. Look what happens here. This is the next step. So with the volume profile, uh, we identified from higher time frame. Now look at that, and this is the classical control I have here. Okay, all this amazing, uh, volume profile based indicator, you can control all the time frames you would like to see all in one place. You can control the trends you want to scan. Absolutely amazing. You will love that. Again, if you want this indicator on your side, go to the description below the video. KTL, Key Trading Level Indicators. Download, install, enjoy. So now the pricing. When we are moving in a downtrend, these swing highs become amazing zones of what I love to call clearances. Okay, they use us also as the zone of supply. The reason is when the buyers are trying to take the control, sellers resist right here and here and push the prices lower. So when we retest these zones, we assume that there is a chance if the sellers are real, they will reject and push the prices down. So here is what happens here. We go back Right in this structure of lower highs, lower lows. We go back to this area and look what happens here— classical rejection, which then turns to be a double top with a bearish divergence. We can see the rejection here, a classical resistance zone. Look at this volume, also the weekly, also the daily, okay? And beautiful Lower highs on the MACD moving averages histogram and the RSI. From this area, we want the sellers to take the control again, and when they do and they manage to make the lower highs, lower lows on the 4-hour chart, here we are. So we break below this range. Let me make it a bit clearer. Okay, we break below this range, we come to retest it, and we build this volume zone. You see that? Now it's a daily volume zone. So from this area, sell is our direction. Everything is synchronized for us, and this is exactly why I choose to trade the way I choose to trade. And I will show the technique behind it. Okay, so sell the rallies is what you want to do. You have to be very specific until when, because I want to sell. Okay, until when? So for me, the idea here is as we develop the momentum, right, We have the lower highs, lower lows. I want— and we have— look at this volume now building. As long as we hold below this area, I'm good with the sells. I cannot predict if the sell is going to be here or is the sell going to be slightly higher from the resistance area. We cannot predict it. Don't even try to waste your time on that. But once you get the pullbacks, this is where you will want to start looking for the sells. And for us, it happened Right here. ABCD correction, a bearish hidden divergence, lower highs on the chart, higher highs on the indicator, creating a classical bearish hidden divergence. Break below this ABCD, all the rest in that case is history. Once that happens, basically this becomes your— sorry, let's go free pen— this becomes your reasonable risk, and the target zone becomes at this area. Why this area? Because if we go to the analysis which we started with the daily, uh, the swing high. So the question is, where was the previous swing low in the most recent pullback upside? The answer is this low and this low. Why specifically here is where we want to target? It's because when this was pulling back upside, this is where the sellers lost the control to the buyers. So when the sellers are back to control, we assume They will go and retest their levels. They lost their battle to the buyers. That's it. And this is the combination, the classical combination of a volume profile swing highs and lows with price action structures and the divergences. So I hope you find it useful and helpful. That was the purpose of this video. Uh, and if you have any questions, don't hesitate to ask me in the comment section below this video or email my support team. They will be more than happy to assist. And once again, I invite you to join us in our trading family, learn all the techniques I have and I apply in real time, delivered to you in real-time trading ideas. As you saw, track recording in the trading journal. You would enjoy from your access to our VIP price action and and endless support in our trading community. Join us with the link below the video in the description or the pinned comment. Thank you for your time watching this video, and I see you soon with more. All the best to you and yours. Bye for now.