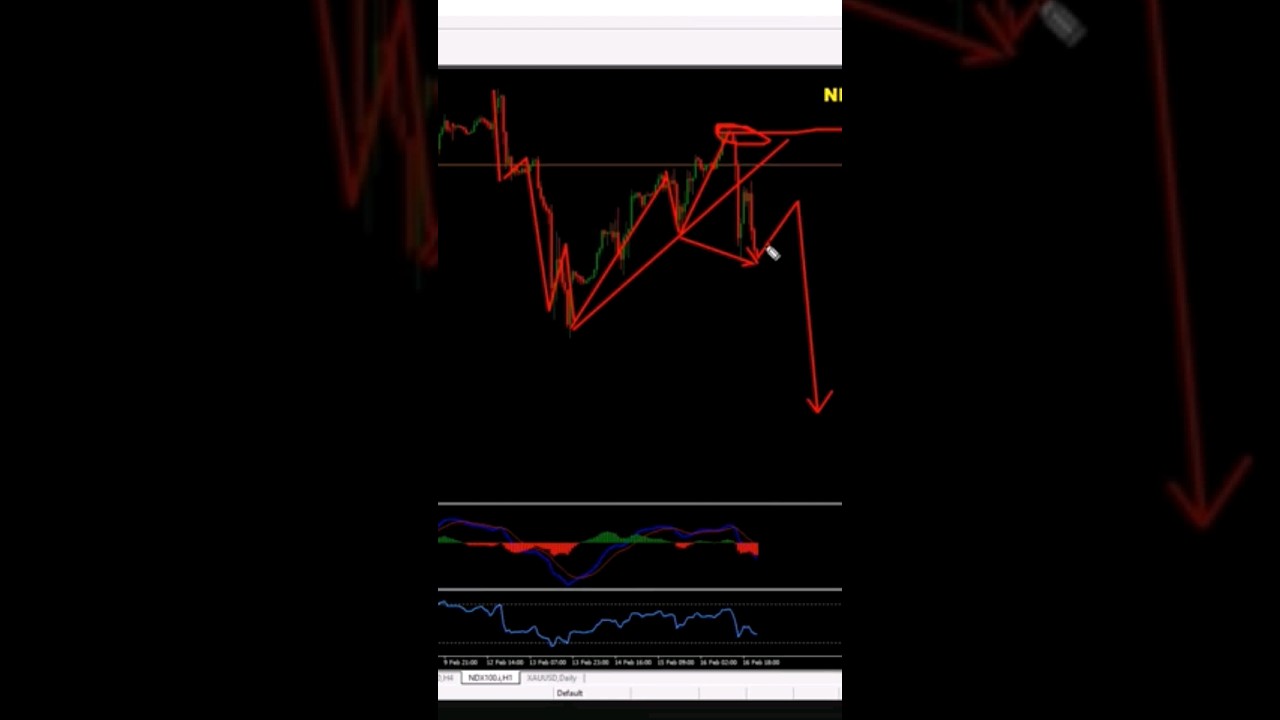
NASDAQ sell trade explained #forex #trading #nasdaq #forexsignals #shorts
20 Feb 2024 · 1 min
1:01
Vladimir Ribakov identifies a bearish divergence on the NASDAQ 1-hour chart: higher highs turned into lower highs and lower lows. As long as the short-term high holds, rallies could offer short-selling opportunities if price drops into the recent low-zone.
Chapters
More from Vladimir






youtube.com
Stop Buying USDJPY: The Critical Resistance You Need To See #forex #tradingstrategy #shorts
2w ago




See all content
