NATGAS analysis & trading plan - 2 July 2024 #trading #fyp #forex #forexsignals #forexeducation
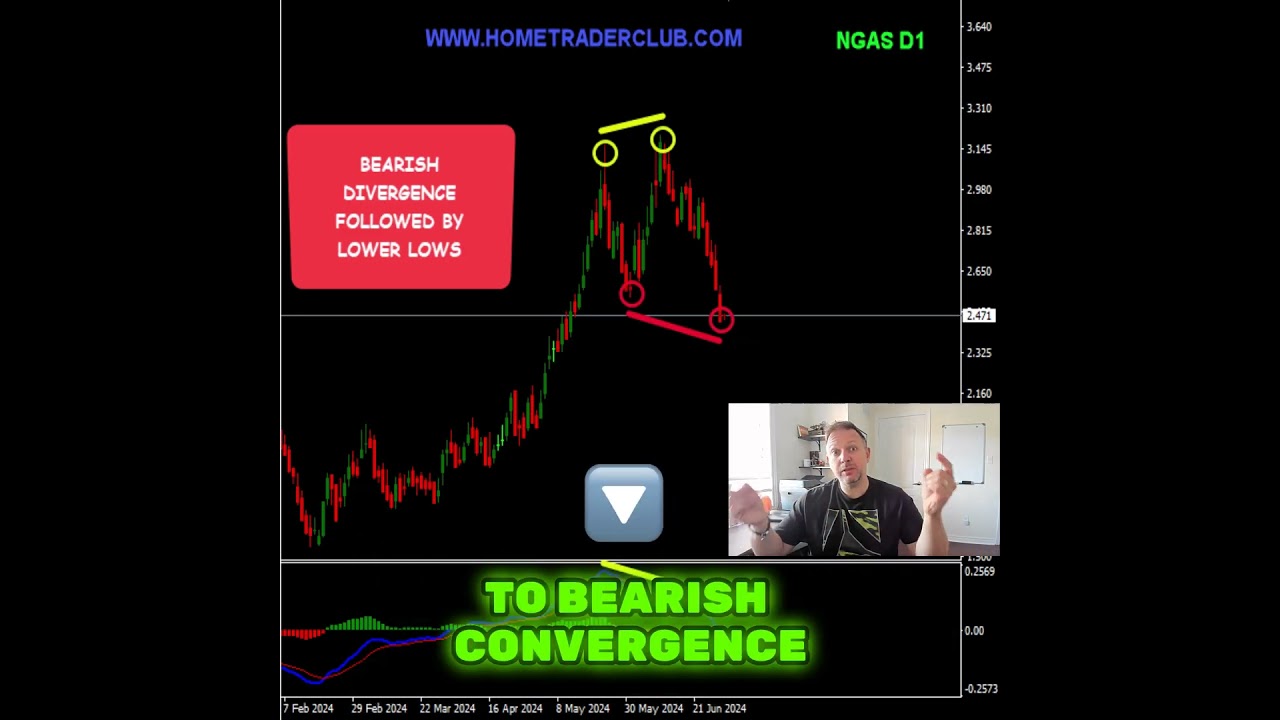
In this brief video, Vladimir Ribakov presents a technical analysis of natural gas (NG) and outlines a trading plan. He identifies a short‑term buying opportunity as the daily chart bounces off a strong resistance zone, noting a shift from bearish divergence to bearish convergence on the MACD. He explains the divergence (higher highs on price vs lower highs on MACD) and convergence (lower highs on price with lower lows on the MACD histogram). On the 4‑hour chart, he points out a clear bearish trend structure composed of three lower highs and lower lows, suggesting that after the anticipated short‑term bounce, the market is likely to continue downward, making long‑term sells favorable. He invites viewers to share their thoughts in the comments.
Chapters
More from Vladimir






Stop Buying USDJPY: The Critical Resistance You Need To See #forex #tradingstrategy #shorts




