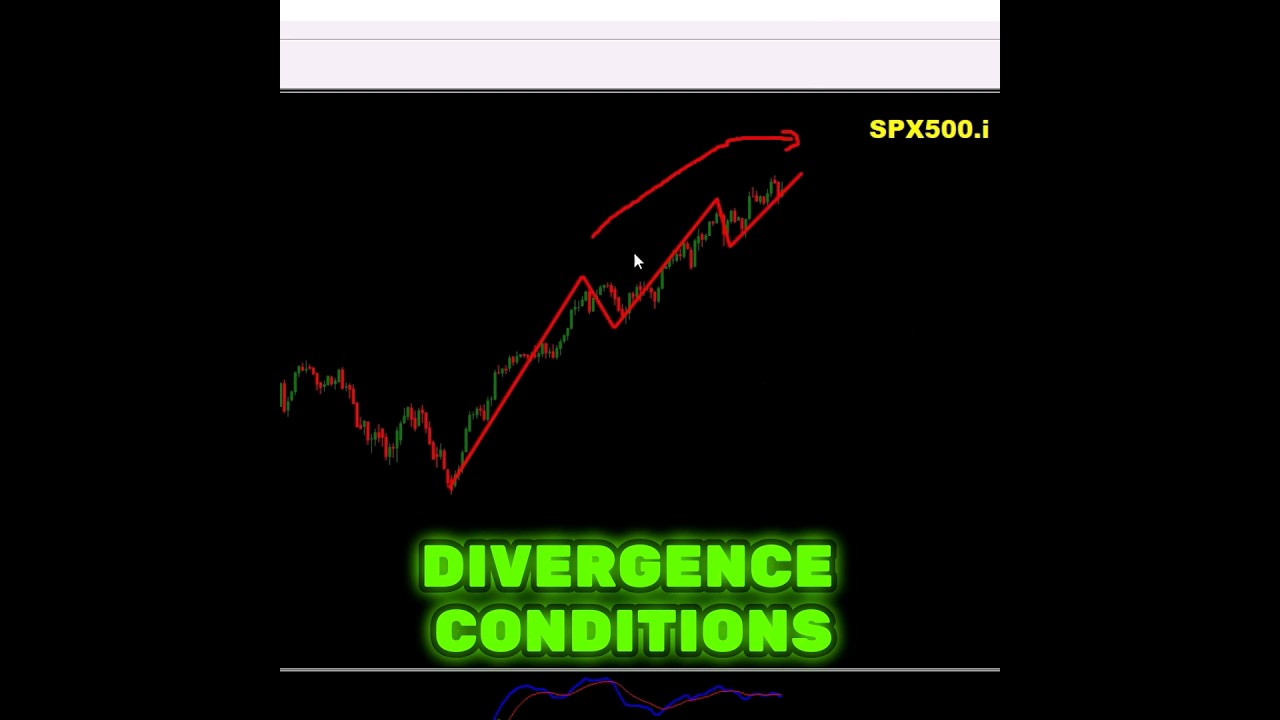
Vladimir Ribakov identifies a potential S&P 500 top using a 61.8% Fibonacci extension, overbought RSI levels matching 2020 peaks, and bearish divergence on the daily chart. He outlines two sell scenarios: selling new peaks in a final rally, or waiting for a break below the recent low followed by a pullback break.
Chapters
Here is why I believe the S&P is about to create a top on a short term, and it's time to get ready for a sell. Plotting Fibonacci extension on the weekly chart on the most recent waves brings us directly to the 61.8 Fibonacci extension level. Besides that, on the weekly chart, we can see that the RSI is getting very close to the overbought condition. The last time it happened was here on 2020. On the daily chart, we are running into 3 waves. The market starts to round on the top and the market creates bearish divergence conditions— higher highs on the chart versus lower highs on the MACD moving average. The first scenario, then the ideal one, would be if we run into one final rally. I will be looking to sell new peaks. And the alternative scenario could be break below the most recent low with 2 waves down, creating a pullback in the 2 waves And then the break of the pullback could be the great sell opportunity. Join us in Home Trader Club for professional trading education and real-time trading opportunities.