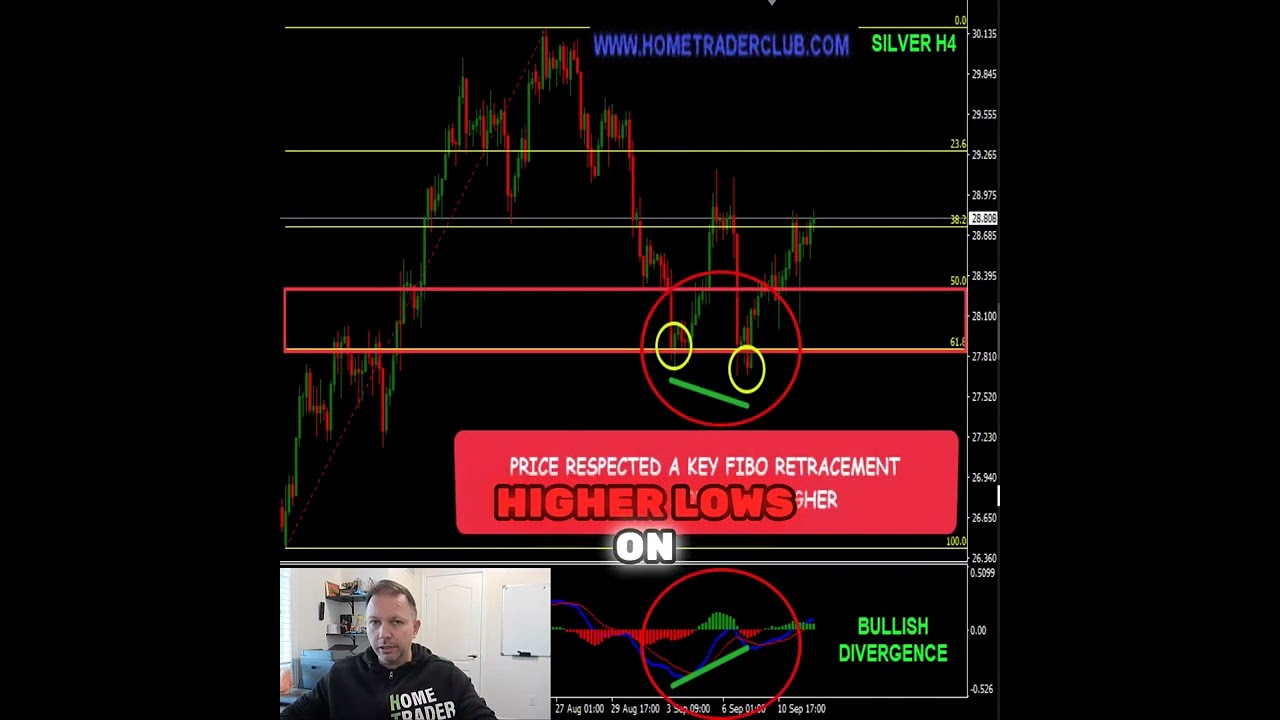
Vladimir Ribakov analyzes silver charts and identifies a bullish trend with a pullback ending in MACD divergence. He sees buying opportunities as long as a key Fibonacci level holds, with pullbacks serving as entry points for further rallies.
Chapters
Here is why silver is a potential buy after a short-term pullback. Let's take a look on the charts. On the 4-hour chart, clean bullish trending structure: 3 higher highs, higher lows. After that, we saw a pullback to the downside. The pullback ended with a bullish divergence: lower lows on the chart, higher lows on the MACD. After the bullish divergence on the 4-hour chart, the 1-hour chart creates or recreates a bullish price structure. 3 higher highs, higher lows. The momentum is shifted to the buyers again. With all this beautiful momentum, there is still some sign that on a short term, with this 1-hour chart bearish divergence where the higher highs on the chart are contradicted by lower highs on the MACD, we could see pullbacks. But as long as this Fibonacci will hold, these pullbacks should be the ones to trigger further rallies.