Vladimir Ribakov breaks down a silver trade from September 12 using technical analysis. The setup: bullish divergence on the 4-hour chart, Fibonacci support on the 1-hour chart, and a buy signal when price respected those levels. Silver rallied over 200 points as predicted.
Chapters
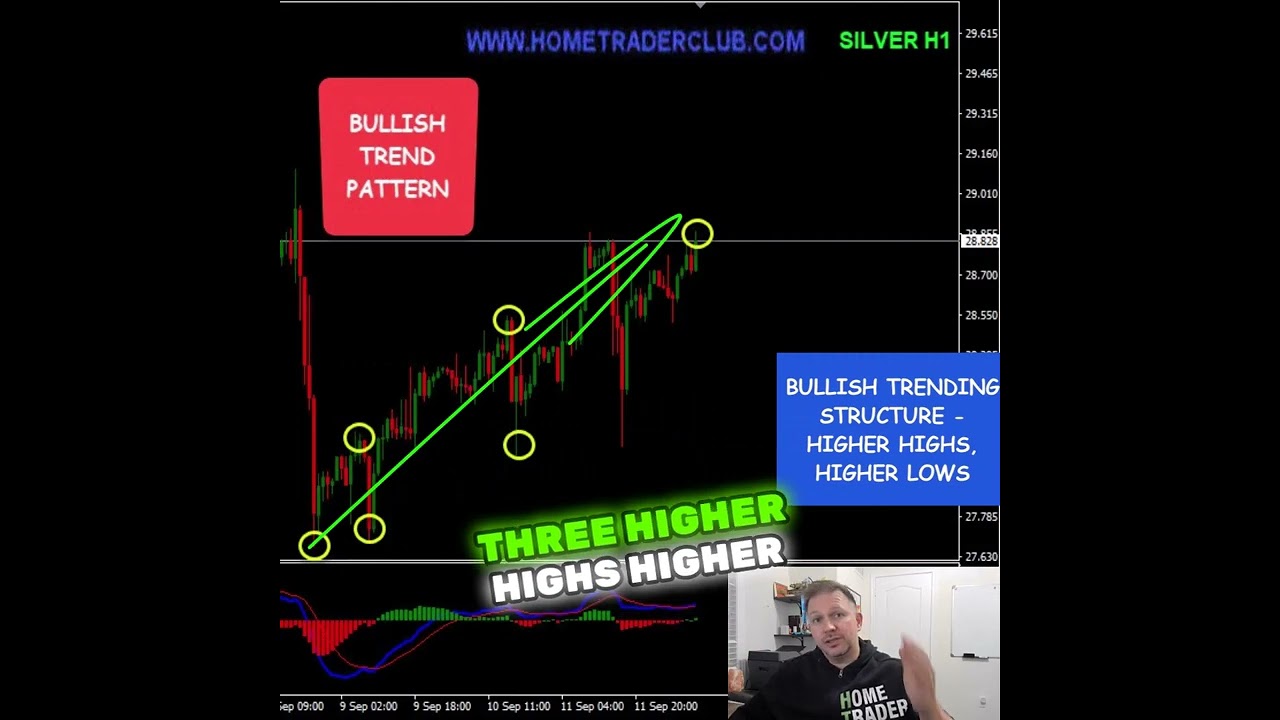
Here is our silver, both the sell and buy trades fully explained. But this was the very post, the original post we published here for you in this very channel on September 12th. Silver sell and buy full trading plan. What we found there was very simple. Classical bullish trend on a 4-hour chart with sequence of higher highs, higher lows. After that, a pullback. At the end of the pullback, bullish divergence— lower lows on the chart, higher lows on the moving average of the MACD. After that, the 1-hour chart makes the bullish trending structure, bullish price action— 3 higher highs, higher lows. The plan: pullbacks as there was a bearish divergence on the 1-hour chart, and after that, buy the dips as long as the Fibonacci levels hold. Here comes the pullback. Right to the Fibonacci levels. Fibonacci levels hold as we wanted to see, and after that buyers take control and push for more than 200 points to the upside. The silver did not disappoint for both the sell and then huge rally upside as expected. For more trades, real-time trading education, real-time trading opportunities, join our family. The link in the bio.