US Dollar Index Buy & Sell Trade Fully Explained #trading #forex #fxsignals #fyp #shorts
6 Sept 2024 · 1 min
0:53
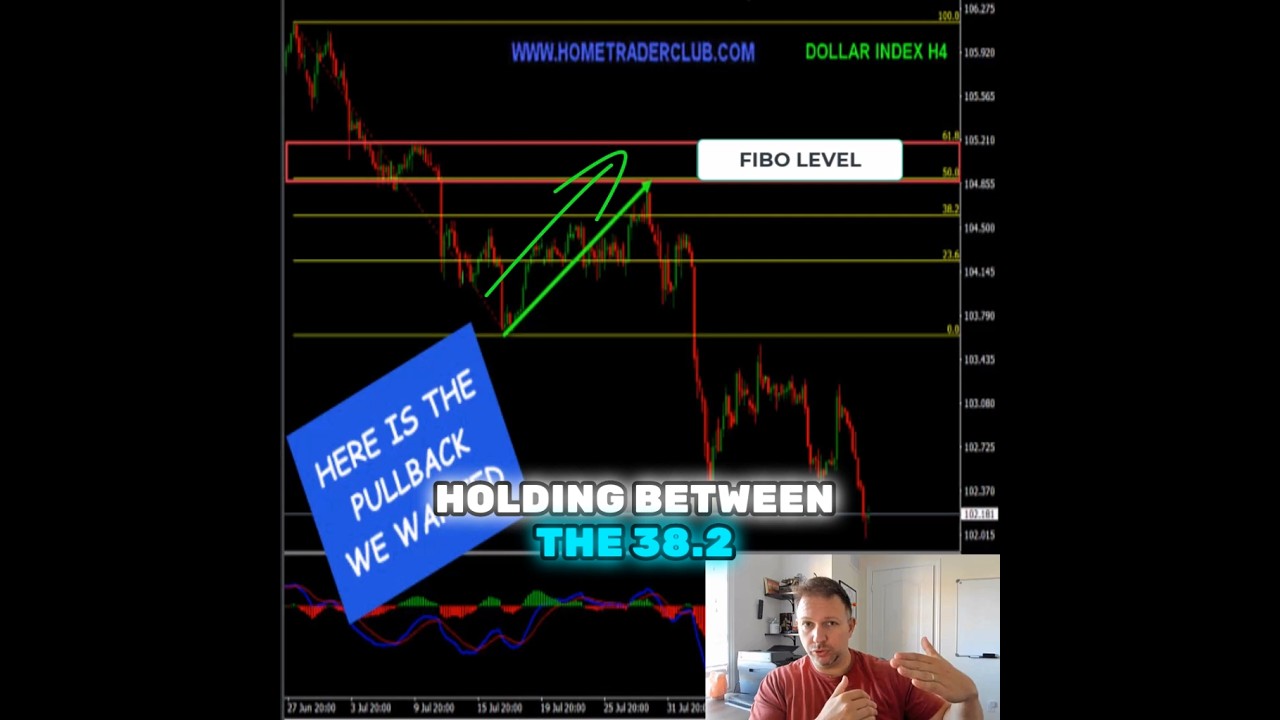
In this short video, Vladimir Ribakov revisits a previously shared trading plan for the US Dollar Index. He explains how traders should watch for price pullbacks on the 4‑hour chart that retrace to key Fibonacci zones (specifically the 38.2%–50% range). When price respects these levels, he advises selling the rally, allowing sellers to take control and drive the index to new lows. The clip concludes with a promotion for the Home Trader Club, inviting viewers to join for real‑time trading education and live trading opportunities.
Chapters
More from Vladimir






youtube.com
Stop Buying USDJPY: The Critical Resistance You Need To See #forex #tradingstrategy #shorts
2w ago




See all content
