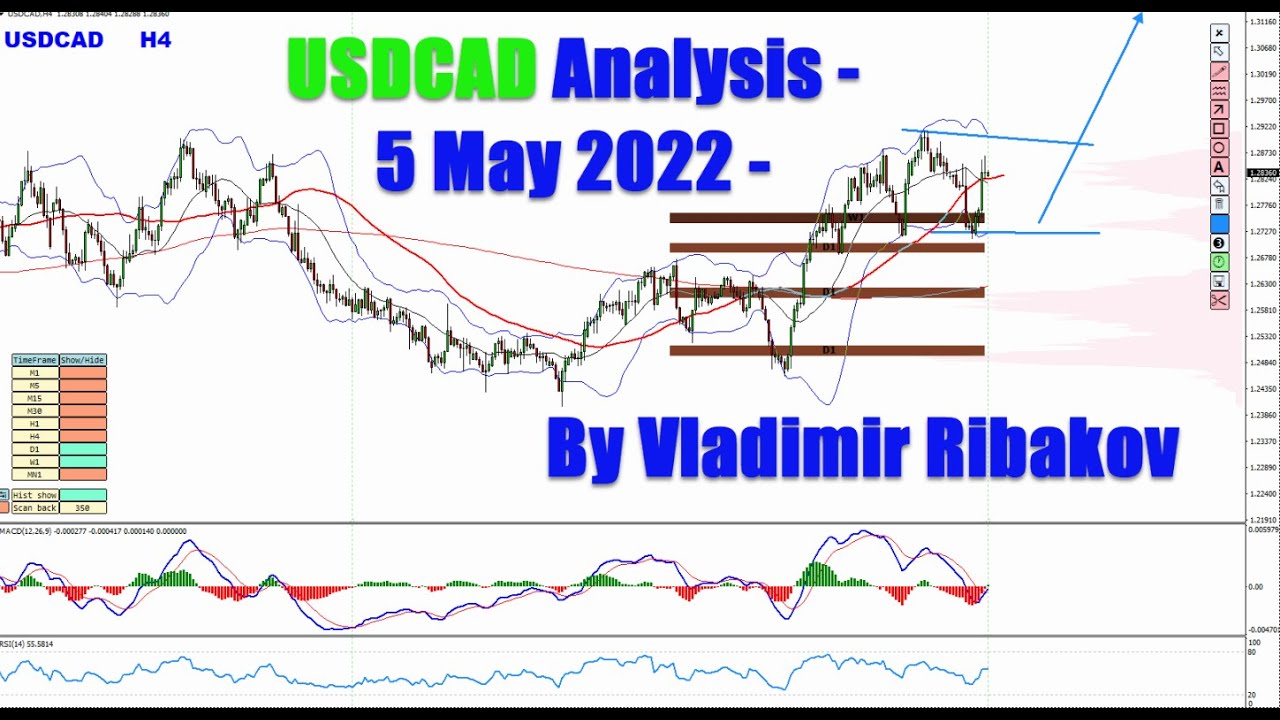
Vladimir Ribakov analyzes USD/CAD on the 4-hour chart, identifying two possible breakout scenarios: a classic ABCD pattern or a range formation leading to a fifth-spot breakout. He stresses disciplined trade planning and only entering when the chart develops as expected.
Chapters
Hello traders, how are you? Vladimir here from Traders Academy Club, and in this video, my analysis and price prediction on a dollar CAD, uh, as a follow-up to the analysis I shared with you in the weekly forecast. But before I go to the charts and explain everything If you are new to this channel, welcome to our amazing community. Please subscribe to the channel with the subscribe button below the video. And also I invite you to join us in our trading family, Traders Academy Club. Enjoy from your full access to the full VIP price action course. Enjoy all our real-time trading ideas and real-time trading education. Every single trading opportunity comes with a dedicated, fully detailed video explaining my trading techniques behind it. To join our family, find the link below and just follow the link below the description or in the pinned comment in the comment section. And now let's go to the chart. As I said before, this is a follow-up to the analysis I shared with you in a weekly forecast. If you missed this video, the weekly forecast, you can find it directly in the channel or right now in the right top corner of this video. I can find the direct link, so watch that and watch the full analysis behind it. Uh, and, uh, now a quick follow-up as we got the some movement after that, right? So going quickly, uh, and recap the idea here, I expected this leg would be completed ideally towards the volume zone and maybe even the previous swing highs which we have here and here. Okay, so once it completes Very likely the divergence there also completes and the price turns down. So following this idea and the current break, or I should say the attempt to break above the falling resistance line here. So we got 2 waves up, some consolidation with 2 waves down, and look at this massive volume. Okay. So far the price holds above it, and as long as it is the case, my view remains bullish. So how do I expect to play that out on the lower time frame? I will explain in a second. Before that, I would really like to ask your support. If you find this video and other videos, uh, helpful and useful, please hit the like button, drop some feedback in the comment section. Your help is very much I appreciate it. Thank you very much in advance to all those of you who help. And also some fantastic news, we have 2 indicators available for you for free download. The first one is this very indicator, the Volume Profile indicator, key trading levels indicator based on the volume. And the other one is this one, this amazing toolbox I've created. This is my virtual trading pen that allows you to do drawing on your chart and use it in a multi-timeframe, save your images, and many more features. Download it with the links below this video in the description. Okay, the first one is KTL indicator, the other one is Virtual Trading Pen indicator. You will find their direct links, go and download it, they are absolutely free for you. So, uh, how do I expect to play that out on the 4-hour chart? We got the pullback here which so far happens in one wave. Usually that opens up one of the two scenarios to follow. The first one is it becomes a classical ABCD and then break above that. In that case, it will also fit with the daily— sorry, with the daily trendline breakout, right? This is the daily. So imagine the 4-hour makes the ABCD, breaks above the 4-hour ABCD and daily To gain the momentum and to take us all the way to the next volume zone, all the way on the top, as we saw that. So the next one, the next opportunity to follow here is actually— I lost connection on the— for some reason. Weird. And the next one, next option here is a possible range. So what Could happen in as an alternative to the ABCD is the price goes in some sort of a range, and then on the fifth spot or with one more little pullback, we got the breakout and further continuation. Example to this, we can find to this range I'm talking about. We can find, for example, a trade that we did trade in Traders Academy Club this week. That was the Aussie Kiwi. So we got a trending structure like we are looking to do with the dollar CAD. We got the five spot breakout: one, two, three, four, and fifth is the breakout, and all the way to the desired zone. So same thing is a possible scenario on a dollar CAD. On the four-hour chart, with this ongoing momentum, we are expected to continue and develop. We might, if it's not ABCD, right? We might see here a range and on a fifth spot a breakout, or sometimes before the fifth spot breaks, it pulls back a little bit and then gains the momentum. That's an alternative scenario to the ABCD. So with one of these. Um, price structures. I, um, that's what I want to see in terms of the price, right? Price action was being called, uh, in the terms and the terminology. So with one of these scenarios, I expect to see dollar CAD continuing and developing. And to answer a very important question, what to do if these scenarios do not build up? Then my answer is nothing. For me, I plan the trade and then I trade my plan. And I suggest you to follow pretty much, uh, the same regardless of what the technique you apply. Uh, you build your plan. If the chart develops what you anticipate, you know what to do. If the chart does something else, it's basically a way of the market to tell you do, uh, nothing. And it's very, very important thing because many times the traders are trying to chase the opportunity rather than to wait until it is created for them. So, um, I hope you find this video useful and helpful. As always, for any questions, don't hesitate to contact me in the comment section below. I'll be more than happy to answer and to help. And once again, I invite you to our trading family, Traders Academy Club, to enjoy from all the best of the offer and the value we have to offer you as our member. Uh, follow the link below in the description or in the pinned comment. I hope to see you with us. I wish you all the best. Uh, happy weekend in advance as the weekend is approaching, and I'll see you soon with more. All the best to you and yours. Bye for now.