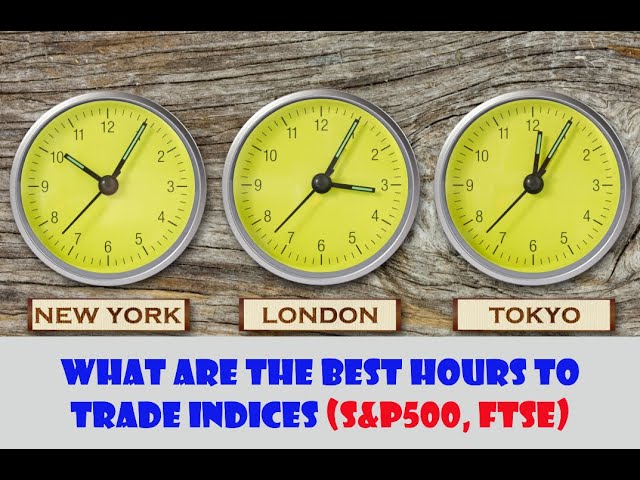
Vladimir Ribakov shows when index CFDs move most: London dominates UK100, New York dominates S&P 500. The overlapping hours between sessions offer the highest volatility. When Tokyo and London agree, New York often reverses.
Chapters
Hello traders, how are you? Vladimir here from Traders Academy Club, and in this video I would like to talk about what are the best hours to trade indices, okay, with the main focus on CFD. This is a very important subject because many traders are trading off hours, especially when it's intraday, expecting high volatility or trying to jump in without understanding when is it likely for the index to make a movement, when it is unlikely to make a movement, or at least let's say, uh, the chances for a movement are much lower. So let's go directly to the trading charts and what you will see here. I'll present several examples. It would be the UK 100 index. I also present an S&P 500. Okay, but it is the same relevancy of all the other indices. But before I go to the charts, I would like to take the moment and to thank ActiveTrades broker for making this video possible. So now let's go to the chart and let's see what do we have here. Um, so I'm using one of my indicators that separates As you can see, the sessions, um, just for the ease of explanation here, uh, of course you can do it with indicator, of course you can do it with the manual. Um, the idea here is what I want you to see is how critical it is to understand what session, uh, brings most volatility to what index. Okay, so let's take a look, for example, on the UK100. Uh, now look how usually during Tokyo session it tends to be more quiet, okay, until it starts to get closer to London session. So if our London session begins here, okay, the closer we get here, it starts slow. Look at the candles. Very, very, very little candles. Okay, and when the London session begins, look, the closer we get, we start to get volatility. Very important thing to pay attention to, that many times— when I say many times, it does not mean always. Some people, when they hear many times or most of the times, they think, oh, that means always. No, that means many times, or even most of the times, London session tends, at least on part of it, to maintain the Tokyo session. Of course, things could happen in the market and the trading direction could also reverse, but many times you will see that in indices, during, especially in the UK, uh, the— during the beginning of London session, or at least part of the London session, it tends to maintain and continue the direction that was set or tried to set during Tokyo session. So if Tokyo session starts bullish, many times you would see London session also does the same. And for UK, London session is most of the time Uh, the most relevant one. Okay, know your audience. So in that case, know your index, what you are trading. If you are trading Australian index, then it's less relevant in a time they sleep, for example. So the— during London session, you would see a lot of activity most of the times, uh, on the FTSE, the UK 100, um Index, and then as it comes, look what starts to happen here. New York session comes in play. Okay, this is the place where they overlap. So theoretically speaking, the majority of money flows during these hours. Okay, but what is a very interesting phenomenon that if Tokyo and London create the same, um, trading direction, um, during, during their session sessions, then many times in the New York session you would start to see the opposite movement. Okay, so if Tokyo and London were moving to the upside, uh, then New York very possible you will see the opposite direction. Okay, uh, let's take a look, uh, here. By the way, you can see I'm drawing with my, uh, virtual trading pen. I'm drawing on my charts. You can see other indicators here. You can download many of my indicators and enjoy some other amazing tools absolutely for free with the link below this video. Just follow the links below this video. You will see many different, uh, indicators. Many of them are available for free. You can just follow the link, install, download, and enjoy them. Now let's go back to other session again. Look what starts to happen here. Okay, Tokyo did not really set any direction. Nothing was clear. But look what starts to happen on London. Okay, again, most of the hours London was following Tokyo. A mess, a mess from Tokyo, a mess from in London. No specific direction, but as the time starts to get overlapping here, okay, the momentum really managed to gain. And here we start to create—you can see section of higher highs, higher lows in that direction. Okay, very, very, very important is to pay attention to the hours. The most activity. For UK starts to be from London and when the time overlaps. These are the most active hours. If we take a look, for example, on the S&P 500, okay, you will see pretty much the same, uh, phenomena happens many times when Tokyo sets direction and London continues the direction. Then by the time New York— okay, which again, this is the American index— New York would be most of the times the most active session. London would be very interesting as it starts to be also pre-trading, right? But during the US session hours, you would start to see the big volatility. And at the time it overlaps London with New York. This window of hours, you will see the most active, uh, trading. Okay, uh, so let's go a little bit back to the previous session. Again, you can see Tokyo starts to set direction before London. London maintains the direction. And as I said before, when that happens, you will see many times by the hours New York and Um, the US overlap, you will see opposite direction, um, in the New York session. Is why it is so important to know the hours and to pay attention to that, because many traders, when they see, for example, in a bottom here, okay, they said, oh, that now it's gonna bomb and create an opportunity. Well, most of the times it will not. As you come to the end of session, the volatility starts to drop in the specific index you trade. Okay, and you will want to trade in the hours when one session is ending and the other about to begin, right when they start to overlap. And pay attention, as I showed, to synchronization of movement. When that happens, the hours when it overlaps give you an amazing volatility and many times opposite directions movement, especially in the New York session, as, um, as you, you just saw. So if you have any questions about anything I just showed and explained about the hours of main activity, uh, trading the indices, uh, don't hesitate to ask me in the comment section. And another very important thing which I want to mention here, which, uh, A lot of traders underestimate the importance of know your trading style. What do I mean by that? If you are day trader, it absolutely makes sense you pay attention to these hours. If you are swing trader and you are riding bigger moves and trends, then specific volatility in a specific session does not really play a role for you. Right? If you, for example, right, if you are a winter sport person, so one bad day or one raining hour or one raining part of the day not necessarily will interrupt your weekly plan or monthly plan of your skiing or snowboarding or whatsoever, right? So It's important to understand that same here, that the intraday volatility in specific hours of session, it is very sensitive subject for traders who trade that. If you are going with indices for longer rides, then of course the specific hours play less important role in your trading decisions. Okay. So that's pretty much it for this video. I would like to thank you for watching. I hope you managed to learn something new and important that could help you to benefit from it in your trading. And I would like to invite you to join us in our trading family, Traders Academy Club. Enjoy the best we have to offer, as you can see on this very image here. And you can also join us in our amazing project we do together with ActiveTrades in our VIP trading group. All the information about both you can find below this video in the description. Okay, so, um, that's pretty much it. Thank you very much once again for your time. I wish you fantastic trading and all the best to you and yours. I'll see you soon with more. Bye for now.