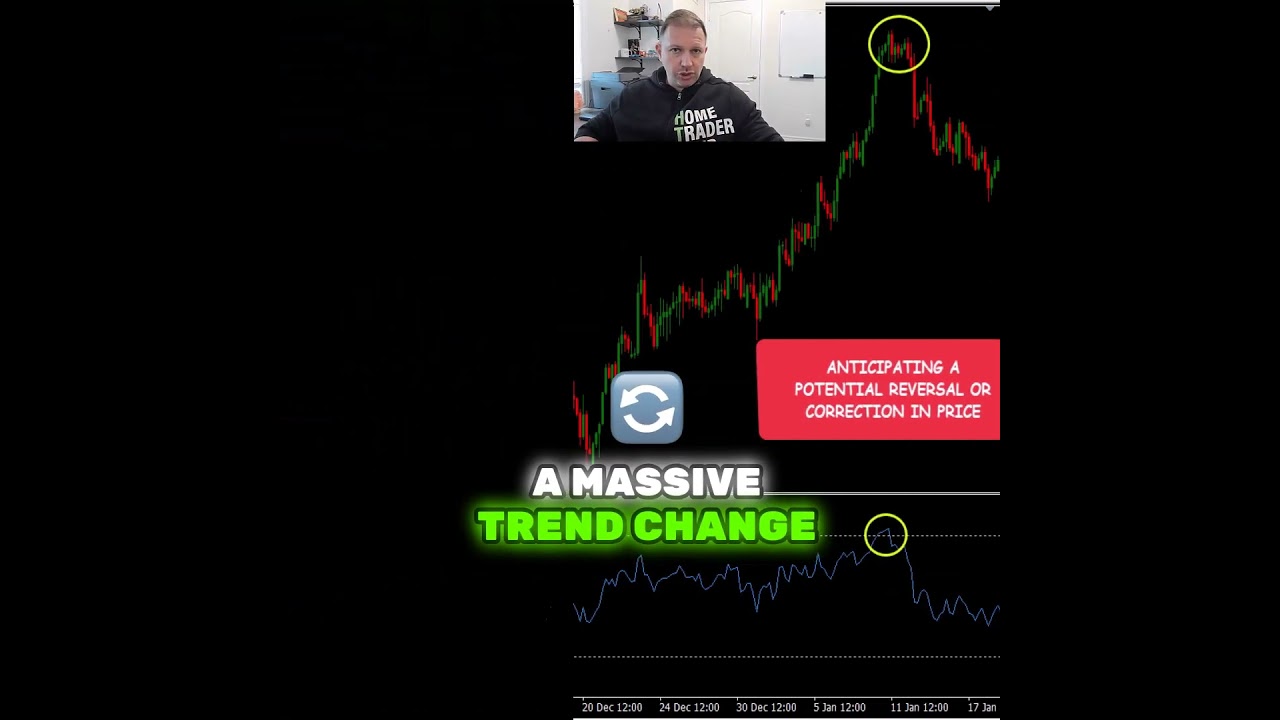
Vladimir Ribakov uses RSI 80 instead of the standard 70 to spot overbought conditions in forex. When RSI crosses above 80, price often reverses. He shows EUR/GBP and EUR/NZD examples where RSI spiked above 80 and the market pulled back.
Chapters
Here is how I'm using the RSI to find overbought conditions. Overbought conditions is when the RSI crosses above 80. By default, it's 70, but 80— and you will notice that watching on the chart— would act much more accurate as an extreme level. So when RSI reaches and crosses above 80, this is your first sign of an overbought condition. Many times from there, we will see the price reacting to the opposite direction, in that case to the downside. Sometimes it would be a small pullback, sometimes a massive trend change. Here is an example on the euro pound after a massive bullish trend that was built by three waves. The RSI crosses above the eighty, creating a peak and overbought conditions just to flip the trend to the downside. Here is euro New Zealand after its massive rally at the beginning of 2020, creating a strong peak with RSI going way above the eighty, creating the peak. You can see the spike on the chart and changing the trend to the downside.