XRPUSD (Ripple) Analysis & Trading Plan - 17 July 2024 #forex #trading #forexsignals #fyp #shorts
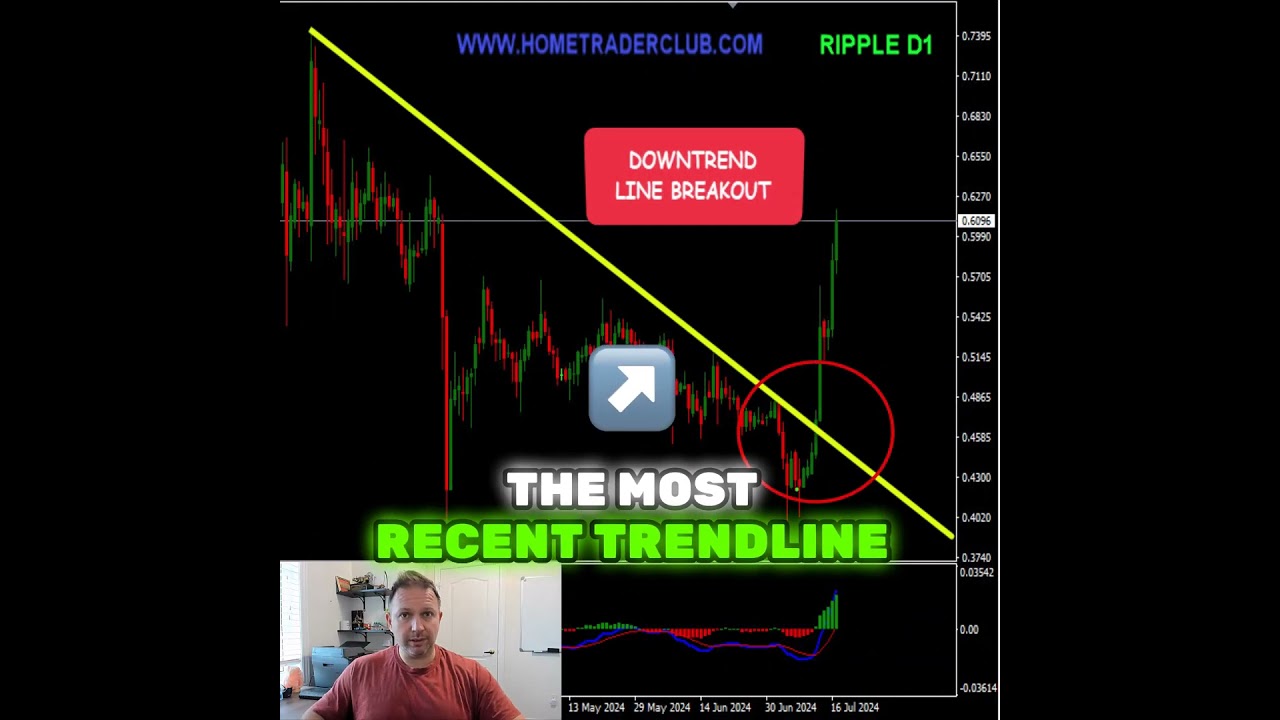
In this short video, Vladimir Ribakov evaluates Ripple (XRP) using technical analysis to decide whether the asset is a buy, sell, or both. He notes a bullish divergence on the daily chart, where price makes lower lows while the MACD forms higher lows and its histogram flips from negative to positive. He highlights a recent upward breakout of a trend line, describing it as classic bullish price action, and points out three consecutive higher highs and higher lows on the 4‑hour chart. Ribakov anticipates a short‑term pullback toward key Fibonacci retracement levels; once those levels hold, he expects the price to resume its rally and recommends buying at that point. He ends by inviting viewers to share their thoughts in the comments.
Chapters
More from Vladimir






Stop Buying USDJPY: The Critical Resistance You Need To See #forex #tradingstrategy #shorts




