Fibonacci Retracement
24 Mar 2022 · 4 min
3:42
Alan Solarsh shows how to draw Fibonacci retracement levels on mobile charts. The 38.2% and 61.8% levels matter most because many traders use them to set entries, stops, and take-profits.
Alan Solarsh shows how to draw Fibonacci retracement levels on mobile charts. The 38.2% and 61.8% levels matter most because many traders use them to set entries, stops, and take-profits.
Alan Solosh here, the passive income guru in this video tutorial explains to you how to draw the Fibonacci on your charts.
Right? So I like to do it on my phone, I like to trade on my phone. It's easier to trade and to read the charts. So this is how you add the Fibonacci. So firstly what I'm going to do is I'm just going to delete all my indicators off my chart. So I like to read everything on a four hour chart. That's how I like to read it. Now a lot of people, what they do is there's different ways of drawing the Fibonacci or different positions to put the Fibonacci. So how you find the Fibonacci is as follows. Firstly, there's a little, it is on the, the triangle, the circle and the square. So you need to click that on your phone. And if it's not in your shortcuts. Mine is already in my shortcuts. If it's not there, then you need to click on the arrow where it says add object and then you need to scroll down to where it says Fibonacci and it's this Fibonacci over here, not the time zones, the retracement. And you just click on the retracements. Okay, now you need to start to draw the Fibonacci. So how you draw the Fibonacci in an uptrend is you draw from the top of the trend to the bottom of the trend. So you need to grab the Fibonacci and where you find the Fibonacci is as I've explained to you, you go to add object and if it's not in your shortcuts then you click on the Fibonacci retracement. So you click on that and you draw from the top to the bottom of the trend. Now some people draw it from the top of the, the top of the wick to the bottom of the wick. I find that it can be added and sometimes it's not inaccurate, it's not accurate. Some people draw it from the bottom over here to the top. That's the one. And the more accurate one is to draw it from the next trend, the next previous high, not the current high. So it's this candle over there. Let me just zoom in so we can see where the candle ends. And in the top left hand corner.
You can see.
A little square so that you can try and get a more accurate point of entry. Okay. And then at the bottom of the trend. You can just draw it over there. That is the end, that is the start of the candle on the low of the previous trend trend. Okay, and as you can see here, we're on a 38.2 retracement zone. And we know that the key Resistance levels are 38.2, 61.8. Those are your key reversal levels. Okay, so this is where the banks and forex traders institutions place their trade. So they'll either put stop orders, buy orders, so take profits or stop losses at these key levels over here. And the price normally reverses at those at those levels. Sometimes it reverses and goes in from a bull trend to a bear train. And sometimes it doesn't, sometimes it just retraces back to a previous support level.
But it's all, you know, we, we can't tell. So it's just interesting to note when the price freezes or when it.
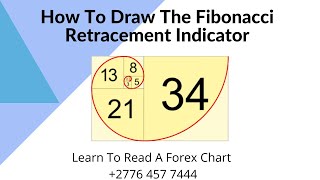
Sort of returns or retraces. It's interesting to note where on the Fibonacci it is actually retracing. So what is the Fibonacci? The Fibonacci is a universal number sequence. And it's found in everything. In shells, in fruit and vegetables, in flowers. How it works is it is the previous number added to itself. So 1 plus 1 equals 2. 2 plus the previous number equals 3. 3 plus the previous number 2 equals 5. 5 plus the previous number 3 is equals to 8. 8 plus the previous number which is 5 equals to 13. 13 plus the previous number 8 is equals to 21. And that's how you get the Fibonacci circle, which is a spiral. It just adds onto itself. Even the universe and the Milky Way is done in a Fibonacci sequence. So we don't know why it works. We just know that it does work. It's very interesting theory. I just use it to watch where the key reversal levels are. I don't use it to make trading decisions. I just use it to observe and note why a price has stalled or why a price has reversed or why a price is trending. Okay, so as you can see, we got to the 38.1. There seemed to be quite a bit of a retracement over here on the 38.1. It's very interesting to say the least. Okay, so this is how you draw it. Just remember that when you're in an uptrend, you draw it from the top to the bottom. And when you're in a downtrend, you draw it from the bottom to the top. So that's how you get your levels correct. Okay. And again, it's. Each person draws it differently. There's no set rule. Some people are actually drawing it from previous trends. So you can actually draw it from this trend over here, the bottom. So let's go to this candle over here. There we go. We'll just click it so we don't move it. So. So if you click it once and there you can see that we passed the 61.8% level. But if we draw another Fibonacci, that's the Fibonacci that's current. We draw it from the top to the bottom. So from there to this trend.
Over here, you can see if we just click it, we go back to here, here, and we can see that we're on the 38.6. So it's very interesting to note where we are and where we're coming to. So I hope that you enjoyed this video. If you did enjoy it, please give me a thumbs up. Leave a comment in the comment section. Subscribe to my channel. It helps the YouTube algorithm and I look forward to seeing you on my next videos. So if you're watching this on YouTube, please come and visit me on my website, the Learn to Read Forex chart website. It's in the description of this video and I'll see you on my course and on future videos. Thanks for watching.

Double bottom forming - Gold ready for $4000 #trading #technicalanalysis #xauusd









