Fractals and buy orders
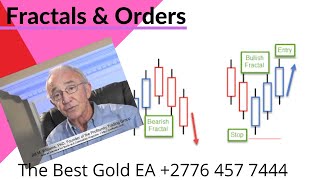
A recorded live trading/help session led by Alan Solarsh teaching a fractal-based entry and order-placement strategy (crediting Bill Williams). Alan demonstrates using platform tools to place pending sell-stop and buy-stop orders tied to fractal wicks and explains exit logic: close trades when a second candle opens above/below the 8-period exponential moving average (8 EMA). He also gives account-management advice (lot-sizing, partial closes, effects of broker bonuses on leverage) and helps participants reactivate an EA/bot and adjust trades on specific accounts.
Chapters
So again, I have to say it again, Duress, because it's not in the recording. Do you accept that I work on your account and help you fix your account?
There is to unmute yourself, keep yourself unmuted because we're working on your account?
Sorry about that. Yes, I do accept.
Okay, cool.
So I'm not a financial advisor. I can't, I can't give you financial advice. I'm just telling you how I read the chart and the way I fix things. So Duress, unfortunately traded through FOMC and his account got into a bit of a challenge and.
His drawdown got, I think 55% and he hedged and then we unhedged and we're now going to bring this account down to 10%, less than 10% drawdown in the next 30 days. What you're looking at over here is my account, a cent account. So there's $2,833 in that account. So I can do what you guys are doing and participate on the telegram group, right? So what I want to show you is a theory called the Chaos theory. Invented in the 1930s by a gentleman. I don't know, it was some dude. But who uses it and who uses it on forex and indices and commodities is a guy by the name of Bill Williams. So if you click on the F function, which is the function key, and then you click on the main window, you scroll to the bottom where it says Bill Williams. The fact that he's on here should tell you that he's a player, he knows what he's talking about. And I'm using fractals so you can add that to your chart. I use it. If you scroll up, you can see my little arrows. There are the arrows.
Okay? And basically how it works is, is that just. I'm not going to go through the whole theory, okay? It's when the price, when you see a fractal and the price drops, okay, one pip below the wick, the start of the fractal, okay? So the price breaks.
If the price breaks, it's on the 50 Fibonacci. Isn't that amazing? So there, if the price goes through there, 1794, that would be a sell signal, okay? So if on this fractal over here, it's one fractal back that you're working, okay? So if the fractal, so if the price breaks there, okay, you can open about trade, okay? And that's how it works. You can do that three or three or four times and on the fourth time don't open any more trades because you're probably at a supporter resistance level. Okay, so let's have a look at. We're going to look at gj. So let's go to GJ and tell you what's going on with gj.
Where is gj? There it is. Chart, chart, window.
And it's broken through the fractal. Or has it? No. So a fractal formed over here this morning and now it's disappeared, which is. There's the fractal. You can see it over there. So let's.
Try and turn the phone sideways and maybe we can see the fractal.
You can see it. There's the fractal over there. So when the price breaks 1 pip lower than the candle. Okay. Or the wick, we can open the trade. So instead of us opening a trade and watching the charts, what we're going to do is we're going to go to the server, we're going to enlarge.
The chart a little bit over there.
Let's move that away.
And we're going to place. So you double click on the chart.
Can you do that?
No.
Okay, cool.
So you go over there, you double click on gj and you drop market execution down and you say pending order.
Right.
So these are the different types of orders that you can get. So what we want is, okay, we want to place an order when the price gets to a specific point. So we're gonna create a sell stop. So when. When the price goes through the. This line, okay. Where we've put our order, the order will trigger and an order will open. Okay, so we're going to use a sell stop. So now we go back to the server and we create pending order. And we go down here and we say sell stop.
And we're going to say at what price do we want it? Okay, so I'm just going to cancel.
This and draw my line.
And.
Right, so we're going to place the sell stop.
There.
149, 282. Now, I've already on with another account with estony who was at 47% and we brought her drawdown down to 10%, probably 9% today.
We already placed, I think, two.
Orders with this fractal over here. So we placed the order, we opened the order there. When the second candle opened below the atma, it was actually there. And then we placed the fractal and.
Then she bought on the fractal as well at three lots. So we're going to do the same thing over here.
So we're going to place a sell stop at 149 282. Right.
So let's go. Pending order down, sell stop.
And we put in, we put in the price. Okay, Stop loss nothing. And we want to put the price in here.
149 282.
And we want to buy a three lot. Okay. We've got more than enough capital in this account to sustain it. And we want to put an expiry date on. We'll put an expiry date on for.
Two days and we're going to say place the order.
Why can we not place the order?
That's 11-492-82.
Okay, then we got.
Okay, so it has been placed and.
I'll show you where it is. Just going to switch on your to your notifications can switch it on so.
That we can hear it.
There they are. Alerts, server events enable. Great. So that we can hear it.
Okay, so if you go over here.
There is the order over there. It's been placed underneath your equity. Okay. So we know that it's there and it's almost gonna be. When it goes green, it means that you're about 10 pips or 5 pips away from your order being triggered. Triggered. And then when it goes through the price, the order will be triggered. Okay, so this is a fantastic tool. Go and watch his video. Bill Williams Fractals, okay. He's an old dude with a ponytail and he's a math professor, I think. And I think he's a math professor and he's, he's got a school and he teaches. The course is $2,500. Fantastic course. Highly recommend that you take it. Going to teach you Elliott waves and fractals and oscillators and all sorts of things. Great system. So what I like about him is that it's mathematical, okay. It's not drawing trend lines and stuff like that. It's a very clever system. Okay, so what else can we do to derish his account to help him to get out of the dwang? So let's tell you where he's at.
Let me just move this.
Okay, so where is at is he's got $10,000 balance and unfortunately he took the bonus from FBS, which I don't recommend because when you take the bonus, your.
Margin percent, your margin drops from 1 to 1000 to 1 to 500.
So it would have done that anyway because you've got a file, you've got.
More than $5,000.
So it would have dropped anyway.
So we've got the margin percentage back and. But I'm just saying that if you do take.
The bonus from FPS, your margin is going to change. Margin, sorry, your leverage is going to change. So if you were on a 1 to 1000, as soon as you take your bonus, your mod, your leverage changes from 1 to 1,000 down to 1 to 500.
Okay.
At halves, which means that you can't place as many trades as you would have been able to if your leverage was one to 1,000. Okay? So I don't recommend you take the bonus at all.
Okay?
So that is the story over there on gj. So we're going to wait for the trade to open and when do we close this order? So people say to me, where do you place your stop loss? Because you saw that there is no stop loss. So there stop loss, take profit. I don't new stop losses and take profits, okay? I want to ride the wave as long as I can. Okay? So people, what normally happens is, is that they make 15 pips and then they close out their trade. Okay? I don't want to do that. So wouldn't it be better if you entered the trade over there and then rode the wave all the way down until you knew for certain that the trend had changed? Wouldn't that be a better idea? Obviously. Okay, that would be a better idea. So when do we close the trade? So who knows when to close the trade? When do I know for certain that the trend has changed? You can unmute yourself, guys, when the.
Trend has changed, when the second candle opens above the atma on the reverse.
Okay? Very simple, okay? Because I'll be my course guys need to do my course. So let's take a picture.
Let's not take a picture. Let's move that and let's take a picture.
Right?
So let's expand it and let's make this black.
Okay? So let's draw it out for you.
So you guys know what I'm talking about.
So here we got the trade is activated there. Then another trade opens over there, and another trade opens over here. And this line is your 8 exponential moving average.
So let us draw the 8 exponential moving average. Obviously, it's not 100% straight.
And it's a bit wobbly like that. And it hugs the thing. And then all of a sudden we get a green.
Oh, goodness gracious, man.
We get a green candle. So here's a green candle, and it's not. Has not opened above the 8 exponential moving average. Then this turns like that, okay? And then you get Another green candle over there. Little candle over there. That's your first candle that opens.
Above the 8 exponential moving average. This is your first candle opening above the 8 exponential moving average. And this would be your second candle that opens by this stage.
Your 8 exponential moving average has moved to there.
Okay, so let's just.
Do that again. And we like that.
Okay, so you can see that this is the first candle that opened above the 8 exponential moving average. And this is the second second. So when this candle opens, let's put.
A yellow line there.
That is when you close this trade.
Okay, Dhiresh, have you got me, bud? Are you with you? Are we together?
I'm with you.
So that is when you will close your. Your trade. Who knows at what level that will be? We don't know. Okay, so. And it may turn today. Why do I say it may turn today? Because we've got dojis here. Got three. They're not doji's. They spinning tops. These are three spinning tops, which indicates indecision in the marketplace. And why have we got those? Let's go and check why we've got those. And you'll see that we're on support lines. Okay. That's why we've got those Doji. So we're on support lines over here. You can see so many places have touched. Okay, this line here. And the public don't know what to do, so they're waiting for the bank to make a move. So if we go back in time, I can do it better on my phone. So you can see here again in April, we're on. We're coming towards support a support line again. So I can do it better on my phone. And this is why I prefer to use my phone. Okay, so there's the support line. So let's bring it down.
There's the support line.
So you can see here. Yeah, you want to see how to check support lines properly. You change your chart. You go to. You go to your phone and you say chart. And you say. Instead of candlesticks, you say line chart. And you go back to the charts and it's changed to a line chart. And if you turn it sideways, you'll see exactly. Okay. Where your support lines are because you don't have so much noise on the chart. So if we. If we go backwards in time, you'll see where.
Where we're at. And you'll see that we're at. Yeah, there you can see there's your support, which is a resistance.
If you're going north, there's more. So that's why there's chaos on the chart and that's why I only placed.
A small lot size trade on this chart.
Do you understand? And are you, are you getting it?
Yes. No. Guys, ask questions.
Yes. Maybe for the benefit of the class, let's go to a scenario where the trend reverses and what your sort of action would be in that case where.
It reverses and then. So what you want to do. Yeah, okay. Okay. So if the trend reverses.
Great question.
So let's say we're over here and the second tr. The second candle opens above the 8 exponential moving average. I'll be. What will you do?
Well, first of all, I will close the. The trade that went south and then.
I will see, I will wait for a fractal to go north to place order going north on that.
Okay, that's cool. That's one way of doing it. I wouldn't do that. I would immediately place a buy trade. I would open a buy trade because I know that it's north, the trends reversed. I know it's north. So I'll place a trade over here. So this is what's going to happen. Okay. We're going to get nice spike north because that's generally what happens. Again, maybe the price will reverse because of a better news and will come down to the eight and the eight will move up like that and then another green will open.
Maybe this price will go through.
Sorry, Alan, I. I just want to correct myself. When, when I say I'll wait for a fractal is the moment that I see a trend reversal. I changed my chart to a 15 minute and I wait for a fraction on the 15 minutes.
Okay, that's clever. Okay. And then we get another green. Okay. And we keep on riding it north. Okay, this trade is open. Now a fractal works in five fingers. That's when it works. Okay, you need to go through it. So let's say you get a little fractal over. Let's say you get a fractal.
Let's say you get a fractal. There's the fractal. Don't you just love my drawing program? It's flipping amazing.
Okay, okay, there's the fractal. So when the price goes up, you can either place a manual trade or you can.
Do a. Let's go back to the picture. What are you going to place? Anyone? Quickly. What are we going to place?
Which order?
Buy stop.
Thank you very much. A bar stop. So we're going to place a buy stop. Okay. Over there, like 1, 1, 2, 3 pips above the.
The wick of the candle, you'll place your order, one order of whatever you want. In our case, we're going to place another three, another three lot. You can go up on the lot size. Why can you go up? Okay, so let's say we placed this orders a, this order here is a three lot, okay? When you see the fractal, you can make it a five lot. Why can you make it a five lot? Because this trade is in positive.
Okay? It's in positive which will cover the losses of this trade if it does reverse. So it'll have to reverse to about here, maybe there for that trades loss to then square out the profit from this trade. Okay? But we're still in an uptrend. So even if the price reverses so a couple of people, which is, it's a good strategy. But you can't over leverage your account. So instead of placing a three or a five lot, you can place a two lot. So let's draw it for you two lot over there. Okay, so that's a two lot, okay? Or even better, we can place a one lot and then what you do is. This is so clever, guys. Okay, you place another order. Where do you place the order? At the 8 exponential moving average. That's where you place your order and you.
For another one lot there. So it's another buy stop order. So when the candle, so let's say a new candle opens. New candle opens. And it's a red, it's a green candle. It's green candle that goes red. So it opens here, goes up green and then reverses down. Okay. Triggers your bar stop, hits the 8 exponential moving average. You can actually put it over there. Okay. Hits your 8 exponential moving average and then reverses and goes north and becomes green. Now you've got two orders, three orders open. You've got your, your initial bar stop. Then you had a bar stop. Then you opened a manual trade on your fractal. Then you place the bar stop over here. That got triggered because it reversed back to the 8 exponential moving average. And that's it. You wait. Okay, now you get another. Now the retro goes down. Now the green candle opens over there. Sorry, Green candle opens over there, goes north. Okay. And maybe you get another fractal somewhere else.
Another fractal.
Right?
So there's your fractal, okay. And when the price.
The price is over there, delete. Oh gosh, we're gonna have to upgrade.
This call for 10 minutes left of this call.
So when the price goes there, you put in another bar stop. If a triggers great. And I would be very careful here if. If you put a bar stop because you're on moving averages. Okay? 34 is not that serious. The 50 is quite serious because it's the 100 on the H1 chart. And there's a lot of reversals on the H1. So I wouldn't place the bar stop here. Okay. In fact, I would close out my trade. Okay. A couple of my trades over here. Especially if you are over leveraged and your account is in trouble, okay? So generally speaking, I would let it ride until it reversed. Until the second candle opened below the at ema. Okay? That is generally what I do. But because this account is in trouble, I would close out all my trades in profit. And then I would take that profit, 50% of the profit, even a hundred percent of the profit and start closing out some of these trades over here.
Some of these trades that are in trouble.
Okay? And that's what I would do. So over here we'll do a partial close. We'll do a partial close of this gold. We'll take out maybe. So let's say we made $300. I will close out $300 of the 56 lot size duress. Does it make sense?
Yeah, it does.
Okay, so now that order has triggered Check, guys. The order got triggered and we're in a loss a little bit because of the spread. And hopefully we will carry on going south. If it goes north, we made a mistake. It happens. It's not the end of the world. Okay? We'll just close out the trade. So maybe if it goes north, maybe we'll lose a hundred dollars or whatever. It is not the end of the world. There's $10,000 in the account. We'll lose 1% and we'll regroup and. And then we will. Then we'll know for sure because the trend is reversed. A second candle would have opened above the atma. And then we'll place the. The manual trade going north and we'll route it north to the.
50 moving average. Does it make sense?
Yeah, I follow.
Okay. So do you have any questions? Does anybody have questions? You can unmute yourself. Anybody? I won't bite. And no stupid. No question is a stupid. The only question that is a stupid question is the question you didn't ask because now you don't have an answer. So unmute yourselves and ask questions. So I can help you to fix your accounts.
My Ellen is Daniel.
Yes, Sorry.
Can I talk?
Yes.
Okay.
I've also got a bit of a problem in my account.
And what I did is I made a lot size 0.01 and chart to H4. But it seems not resolving it from yesterday.
Yeah, no.
I wouldn't put it on H4. I would leave it on H1. What's your drawdown?
20%. Currently.
H4 is too slow. I would move it to like a 15 minute chart.
H1 or.
M15.
Yeah.
Okay. Okay.
And just wait for the.
On all the charts or do I do chart by tile cut four pairs.
Well, you're supposed to actually make all your pairs. 0.01.
Yeah, yeah, I did that.
I leave mine on one minute. It depends on how. On when you caught it, the drawdown. So I normally catch my drawdown at 10%. Between 8 and 10%, you need to change to 0.01 and then write it out. If you've waited and you've waited till 20%, you'll probably need to fund your account.
Yes, I, I did, but it seems like a little bit slow.
Yeah, H4, it'll be very slow. Nothing's going to happen. But if you've got a challenge and I'll help you within a week or two.
Okay, okay.
Or you can follow the strategy that I've just shown you and try do it yourself. But if you're not an experienced trader, don't use lot sizes. Use like a 0.01 to start so that you can start understanding the strategy and make your mistakes on small lot sizes, not big lot sizes.
Okay. Okay. Cool. Okay.
Anybody else got questions on this strategy that I've just taught you?
Alan, my question is just maybe an extension of what you've taught here.
With, with, with. With my butt being in trouble on the GJ chart.
Okay.
What is your GPA number? 543002.
I think you may know it better than I do. I can go look for it.
Okay, I'll need to pause this and then I'll go look for it. Okay. Yeah, talk.
So this chart seems like it's moving south even further.
Right.
And I was wondering if we shouldn't reactivate the bot because my, my bad trades is getting close to the bot now. Well, to the, the current.
Yeah, so let's do that.
Let's do that.
So, inputs, load.
Gj. What is your magic number.
On, on the other trades?
Yeah, I think 2014. Yeah, so let's do that. Load GJ 2014.
The bot is there. We must just activate it.
Oh, okay. Wait.
Yeah, that shot.
Fantastic. Fantastic.
Three Lots.
Fantastic. Let's go. Let's play some trades.
Okay, great. So it'll open some trades there and one gj. Yeah. So where are your manual trades?
None.
Just go to the date. Go to the day chart. No, no, no manual trades.
Nothing.
Nothing.
Okay, great.
Perfect. So we'll just wait for the. For the EA to open some trades here.
Okay.
All right. Yeah. If you go to the day chart, you'll see.
How far the trades are.
Day chart.
Yeah.
You're closer.
Yeah, it's getting closer.
Yeah, I think go down to the 200, which is where your. Where's your take profit. There or there?
No, down there. It was up there with those other nine trades that we opened.
Oh, we manually moved it, obviously.
Or we closed. We closed those nine trades, obviously now.
Fantastic. Okay, cool. So I think that the price is going to. This is daily. Let's check what's happening on the H4, and then we can zoom. Zoom in and see what's happening. Are we on the support line? If it breaks the support line, we are going down to the 200 moving.
Average, which is where your take profit is. Okay, okay.
That's what's gonna happen.
Okay, cool, cool.
So. And I think you guys know I'm very seldom wrong.
I am very seldom wrong. So I would highly recommend that you learn the strategy that I'm teaching. So it's the end of the call. Has anybody got any questions before this call ends, or can we end it there?
I'm good.
Okay, cool.
Thanks.
Wonderful. Okay, well, you need to phone me three, four times a day like Anthony does so that we can fix your account. Okay.
We'll definitely be in touch.
Okay.
Great liquor.
Wonderful. Guys. Have a good day.
We'll speak soon. Cheers.
Thanks, Alan.
Okay, bye. Bye now.
More from Alan





Double bottom forming - Gold ready for $4000 #trading #technicalanalysis #xauusd





