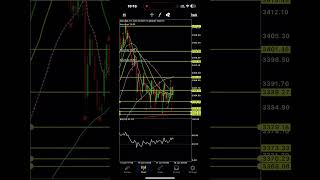
YouTube live trading clip by Alan Solarsh (ambassador for FBS) providing real-time technical analysis of a bearish wedge formation. The speaker discusses indicators: bearish wedge pattern, candlestick analysis, ATMA, 50 and 200 moving averages (H1 context), order blocks and fair value gaps, and notes the upcoming Fed interest rate decision as an event influencing direction.
Chapters
Alan Solosh here, master trader and ambassador for fbs. So we've got a bearish wedge that has formed here. It is going to be the Fed interest rate decision. Bearish wedge means that way. I don't follow this technology. I follow the technology of candlestick analysis. So the second candle is still below the ATMA. We've got one candle above the ATMA over here. Price has paused on the 50 moving average, which is the 200 moving average on H1 significance. Why? The institutions trade on those moving averages. So also we're on an order block. I'll show you where it is. So these lines over here is where the order block is. This block over here. And where does it start from? You can see that there is a fair value gap over here. I don't think this is an order block. I think it is just emotional trading. We need to break out of this channel to see direction.