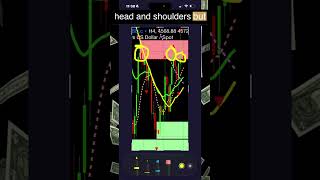
Alan Solarsh analyzes XAUUSD gold price action, identifying two consecutive 50% candles forming a double-top pattern in a supply zone. He expects a sharp reversal into a nearby demand zone, with converging moving averages suggesting an imminent move, though direction remains uncertain.
Chapters
How's it everybody? Let's look at the charts because something very interesting just happened. If we look at the chart, okay, we've got two 50% candles that happened. Here's your first 50% candle, and then here is your second 50% candle, which is almost a spinning top, and we're in the supply zone. I'm expecting the price to come all the way back down, possibly to here, maybe even into the demand zone here. I think that the price has definitely paused at this level, as we have also— other people like to call it a double top, which is the top over here, top there, small little top here. It's not really a head and shoulders, but not really a triple top either. I'm definitely expecting a reversal as this seems to be resistance levels on the chart. What else can I see? Although the second candle is above the ATMA, we're still seeing resistance and reversal. I'm also enjoying the fact that the moving averages are converging all down again, which is nice because when it does get down, then we can expect a move. We don't know which direction, but a move is pending, and we'll just have to wait and see what's happening there. There's still risk. Nothing changed in the East. I did post on Discord what my thoughts were regarding Trump's next move, and you can go and check that out if you want to hear more about it. Join my Discord, it's free, and I also give updates on how I read my chart on my Discord. So come and join us. I'll see you there. Cheers.