Sept 9 Cot Data
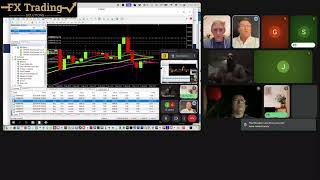
Alan Solarsh walks through Commitment of Traders data, a weekly CFTC report that shows institutional gold positions. He covers how to read longs and shorts, spot when big traders are reducing positions, and set robot presets and risk rules accordingly, including avoiding large trades near quarter and year-end closes.
Chapters
Have questions. So you guys. Okay, so the point of the the.
Google Meet tonight was to understand cot.
But before we go there, some of your robots aren't opening up trades. So hands up. Whose robot is not opening up trades and you don't know why.
Or just emoji thumbs or something?
So everybody knows why their robots are not opening.
Can I say something, Martin? Now, basically it's like you said, I mean the setting is of the all time high and that's why it wasn't opening trades. And also the two cans were still above the 8AMA. So that's what I understand why there was no traits opening. So I figured out that, you know, even if I went to the automatic setting and I put it to false, it wasn't opening. So like I said, I mentioned an option. I think it was section two where it says four sequence or something. That's that allowed me to place some trace. But I did put my robot off again because I know it's a bit of uncertainty with this all time high where the price is going.
Manually. I'll monitor my phone and close trades.
If I have to.
I see there was a Doji on H4. When was that?
Was that this morning?
At 9 o' clock this morning. Interesting. Okay, cool.
Okay, so what questions do you have around Cox data?
You can unmute yourselves and talk.
Open queue. So Grant Nash has raised his hand. Grant, you can unmute yourself. All right, thank you very much.
Sorry, just on your previous question, I'm still using the conservative settings. I switched my robot on last week, Tuesday. So between Tuesday and Thursday it didn't open trades. Friday last. From Friday last week it opened trades but only two trades at a time. And then it closed it and opened two close. And this afternoon it opened four trades. And so just so that you know.
But mine is going to trade simultaneously.
Yeah, it's like two trades. It's on two, it's like on the two 30 minute charts.
Okay.
But I'm happy with what's happening.
Need to just check that you're, you know, I've only got one session of MetaTrader 4 running.
It is.
Yes.
Cool. The thing that you need to really watch is your open times.
Of your trades. So if you're getting trades open at the same time, we need to understand why. So this was two separate.
Magic numbers, 30 and magic number 333231, which probably closed at the same time and then opened at the same time. That's something like that I'm seeing there. And this one as well, which is 30 and 1. So I'm thinking that is a closed on MA reversal. I'm thinking that's what that is.
So just, just looking at the chart.
Our 30 minute chart, we have moved quite a bit away from the all time high and we have had candles below the eight ema.
Let me just hide my news.
Okay. Let me just close the. I don't like working on my main account. I'm going to close it and I'm going to rather open up a demo.
Account because I make mistakes.
So let's do that.
Let's just open up a new chart window.
30.
Okay, let's zoom in.
Okay. Do you know that you can do this? You can mouse down and shrink your chart on MetaTrader 4. I think if you double click it. Yeah, if you double click it here, it resumes back to its original size. Okay, little hack for you. And then you can also.
Press this green button and then the, the chart, the candles move away. There's a, there's like.
A tab almost.
So if I press, it should lock.
Can I scroll?
Okay, so if it's unclicked I can scroll and then I can. If it's clicked I can scroll. But then it goes back to its ordinary place. If I click there, then there's that indent which is quite nice. That's. So you've got a bit of a space here.
So you can draw shit.
Okay, cool. So the point of the call was. You're right, Martin. Candles are below the atmo on 30 minutes and no trades will open on your 30 minute chart. And on your 15 minute chart, candle one is below the atma. So 15 minute chart will still be trading. 30 minute chart will not be trading.
Cool.
All right, so who's got questions regarding cut data?
Like you got to talk, you've got to ask questions.
I haven't looked at one recently, so I forgot what it actually looked like. There's so much information on.
Okay, so who doesn't know what cut data is?
Put up your hands for nickel. Cool bananas, Paul.
Straight on.
Okay, cool.
Okay, so let's start from the beginning. Right, so cotton data is an audit of the biggest institutions in America. So there's an audit of the biggest institutions, the hedge funds. And then which is non commercial. So banks, hedge funds.
Brokers, stuff like that. That's non commercial. Okay. And then there's commercial audit, which is mines, jewelers.
This is, I'm talking specifically for gold. So every instrument is different, obviously. So if you're dealing with, let's say cotton, it's different. Then you've got your hedge funds that deal in cotton, and then you've got your farmers that sell cotton and people that buy cotton, like wholesalers. That's commercial in gold. Commercial is jewelers, mines, etc. Okay, so it's an audit. And it stands for COT data. Stands for the commitment of traders. You can get the data yourself if you want to. It's on the CFTC website. Okay. It's a government website. So it's an audit by the government. Stands for the Commodities Futures and Trading Commission. And every institution that trades has to submit their data, their trades, open trades, closed trades on a weekly basis. So cut data runs from Tuesday to Tuesday.
So today's Tuesday. So it's the end of cot data week. That's why there's a drop in gold. It's not like a mystery. Okay, so now you know why. If we look at the H4 chart. Let me just do it differently.
It's just harder this way.
Okay. I prefer trading on my phone. I've always traded on my phone and I just find it easier to look at the charts on my phone. I like it that way. Okay.
I don't know what account I'm on. Yeah, it's not the account I want to be on. Okay, cool chart. Gold grooming. Okay, cool.
So.
That'S why there's this drop. The institutions are closing their positions. They're hiding their positions. It's obvious what they do. Again, knowing this information puts you in a very powerful position now because. Because now you know what they're doing. Okay, so the week is not over yet. So they loaded all these long positions. Okay, so last week's COT data.
Or was it the week before?
The week before cut data.
Okay.
I get very mixed up with it. Okay, this is.
Data that ended on the 2nd. It's the week of the 2nd. So if you go to the calendar and you say, okay, it's the week of the second to the eighth, so it ended there. So it's data from Tuesday the 26th to Tuesday the 2nd. That's what this is.
Okay, so cut data is a week behind. You need to remember that. All right, so in other words, if we go look at the chart.
You need to go to.
The 28th and you draw a line.
28Th, 28.
From like 27 to end. From there. Okay.
Can I change it?
Right. Properties. Good.
Let's do a thick line and let's make it yellow and we save.
Cool. Done. Sweet.
Okay. And then we go to the next week, which is Tuesday okay, so it ends on Tuesday.
What did I say?
Second.
Okay, so there's this. Where are we? Second. Nine o', clock, there's the third, right?
No man, come on.
So that's it. I would even like go to there and then just like save it. Okay. And then I can't shrink my chart. So let's rather go to a day chart and then you can see it, right, that's from the 22nd to. Sorry, the 20, what did I say?
25Th.
Is it the 26th? The 26th. 26th, Tuesday to the 2nd. On the 2nd they got a close off. They got to close off their books, not their trades. And then they got a write an audit and they submitted to the cftc and they can do that from Wednesday, Thursday, Friday. It has to be submitted by Friday, 5 o'. Clock. Okay, by 8 o', clock, by 10 o', clock, South African time we get the report and you can get it yourself. You can go to the website and you can go and download it. Where do you get it from? You go to commitment of traders, there it is. And then you go to.
Mercantile. It's the short format. Okay, so commodities, it's. Yeah, it's US Futures. Okay, so it's US Futures is what we want. All right. But I've got the URLs for you on the training website. They're there. So we'll just go and get it for you here. And we do gold, right? Here's the gold. I'll drop it in the chat for you.
So that you've got it. You can start like plotting it yourself if you want to and start like tracking it yourself.
You don't have to rely on Alice.
Okay, and then we need. And then I plotted over here, all right? So it comes like this in a RAW format and then you click on control F and you write gold. And it's the first one that comes up because there are two gold. There are two gold announcements, not this one. We don't want micro, we want the futures. All right? And then I copy the long and the short, and then I copy the commercial long and the short, all right? Just to track what the other institutions are doing. But they don't move the market. The ones that move the market are non commercial. I don't know why they say it backwards. I'm telling you it's there to confuse you, okay? It's there to mess with your head. Like these financial institutions do not want you to understand this, all right? And it's pretty obvious. Like I can't get A payment gateway. Why can't I get a payment gateway? Why can't people pay for my product normally? Like with a normal. Put in your credit card and pay. Why must it be a mission? Okay, for my clients to do business with me, it's like bizarre. All right, so I take these numbers and I plot it in, but it means nothing. You have to have it in an Excel spreadsheet so that you can understand what's happening, what they doing. Like, what is their modus operandi here? Okay, what's the game plan? Okay, so I know from past history that the maximum amount of long positions that the institutions have ever had at one time is 408,000 long positions. All right? And there are three. Now they. They've got 315,000. What's amazing is the change in long. They added 40,000 contracts. Okay? So now this is important to note. Okay? So from here to here, they added 40,000 contracts.
So we can now basically understand what they doing. So what can you expect from this week? It's not going to be 40,000. Why.
Come?
I think more and more people are buying.
Okay.
Sorry.
It's like a herd mentality. You know, there's more people following. If they understand code data, they're following as well. They're retailers, retail investors like us.
Okay, anybody else want to answer before I tell you my answer?
Come, guys, think. Anybody?
Why is it not going to be 40, 000 positions added this week?
Okay, Chevy, you can unmute yourself. Paul, unmute yourself.
Sorry, very much a newbie here, but they've put so many cells in that they need to start buying soon.
Okay, thank you. Next.
Paul, unmute yourself. Put.
Paul, can you unmute yourself?
Let me unmute you.
Okay.
Try and unmute Paul.
Martin. Just check on chat GPT on how to make you an admin, please, bud.
I think Paul had his hand up earlier when you asked about who needs more info on got data.
I can't unmute. I can't unmute you.
Okay, maybe. Okay, so Paul, lower your hand. Everybody lower your hands. All right. Interesting what you're saying, Chevy. Now this is not a scolding and it is not.
No worries.
Okay, cool.
I know that my. I don't get it. Right. My communication skills are.
There is a retail thinking mentality to think that they are now going to start adding shorts. And I'll back it up. My fact. Okay, now how retail traders will think is that they'll say, what is the percentage of this number to this number? Their current holdings to this number? It's 77.32% of the all the way from the all time high of holdings. Their current holdings compared to their short holdings is 83%.
My mother. What do you want?
Steps to make someone co host. All right, can we just do that quickly? Join the meeting. At the bottom button.
Host control shield icon and lock.
Turn on host management.
Why did you just call me your mother?
My mother's also whatsapping me there. Mother.
Yes, I was just about to say.
Okay, where is it? I don't know. Read it.
Wait, hold on, I gotta find it.
Open the people panel.
People panel.
I've lost it.
Oh, there we go. Find the person you want to promote. That's me.
Next to the name. Click the three dot menu. Add as co host.
Sorry Alan.
You need to be on that little lock icon. So if you click on the lock icon, you need to do everything inside of there somewhere there will be host management. You've got that already enabled now if you look, you should see some.
Just see if there's people in there.
You can't access users there, right?
No.
Chat moderation.
Okay, click on the three dots.
It's just mute.
I can't. We'll have to leave it and work.
It out another time.
We'll do it tomorrow.
Yeah, hundreds. Okay, cool.
Okay, so that, what I'll get back to what I'm saying is the.
Longs compared to shorts, they've got 83 of their holdings in longs and 17 of their holdings in shorts. Now the retail thinking is that. Oh my God, that's high. They might probably going to start shorting. Let's start shorting gold. And that's where you get tapped out. You don't trade against the institutions. Okay. You need to be very conservative when you, when you're doing that. If you're going to open shorts, then I would say your short positions should be 17% of the lot size that you're using for your longs so that you've got an even decent load proportion on your lot sizes. Does that make sense?
Thumbs up, thumbs down.
Great. Okay, so.
That'S.
Not the reason why they're not. Why this 40000 is not going to be 40000 next week.
Let me show you why it's not going to be 40 000. Let's go on to a four hour chart. Because they're taking profits.
They'Re closing out positions. They either loading shorts or taking profits.
So I see that we have a, we have something going on the chart.
That I need to plot.
Let's go here.
That is very interesting.
That is very interesting.
Template for our fib demand.
And there is another one.
For our fib.
Okay, so we'll get into this now.
I'll explain to you what I've done.
So it looks like.
Oh, gosh.
Oh, God.
It's a long day.
It's been a long day. Okay, cool.
So look at that price. Wicked into the demand zone. Okay, so they took. Okay, it's like. This is mental. Okay, so you guys need to focus here. So this is a demand zone. This is when I know, okay, that this is where they put their orders. The banks, the institutions have placed orders at this level. Okay. So usually it's at a 50 candle. 50 candle or a doji. A 50 candle is the candle length is 50% of the entire distance from top of wick to bottom of wick. I've added a 50 candle body onto my trading view and also onto. Onto the robot. Okay, these is white lines here. Wherever there's a white line, that is a 50 candle. Now you know. All right, so you could effectively open a clean chart. Now, it only works with the robot. Unfortunately, it doesn't work. I haven't managed to add it on the template yet. But you can see that these are 50 candles. Okay, so usually when there's a 50 candle and then a big move up, it's called a fair value gap. So it's a 50 candle. And then the next candle needs to be an engulfing candle, needs to go above the wick of the last candle. I would go so far as to say. Yeah, so it's from there. No, it's from there.
Okay.
So there's a 50 candle. It's a doji. Let me. Do you want. Let me take a screenshot.
I'm sure this is going to be.
Easier for me for you guys if.
I enlarge it on the screen. Groovy.
Okay, so there's the doji. All right. And then the next candle is another 50 candle. So it went up. And then you've got this candle here, which is the fair value gap candle. So now we know that the institutions placed large orders here, and because they placed the orders, the price went up. Okay, unmute yourself, Paul.
Okay, you want to type in the chat. Seems though you can't unmute yourself. And then Martin will tell me when you've typed a question, and then I'll answer it. Okay? So do you understand that part? O. Put your hands down if you don't understand. Thumbs down if you do not understand what I've just explained to you. Okay, so let me say it again.
50 candle. Then a big move up an engulfing candle. Then we know that there are orders here. The institutions have placed orders in this area and it's a point of interest.
Thank you Chevy. And because there's been orders placed here, the price has sparked north. This candle now is called a fair value gap in feg.
Now how do we know that the orders there. It's obvious.
Look.
There were orders right here.
So the price came down. So they took profit here. I don't think that they put cells in. I think that they took profit. They closed out trades to trick the public, to trick retail. Who's retail? We need to distinguish who retail is. Retail is anybody that is not non commercial.
Smaller hedge funds like.
Not Cathie Wood, not.
Not the big guys. Okay? Not Berkshire Hathaway, not.
Any of the big oaks that are proper that can move the market. They are not that we consider those people retail. Okay, so why do they do that? Why do they need to take profit? Because.
Higher. Please mute yourself.
Please mute yourself.
I'll do it.
This is why I need a co host.
Mute all.
So why do they do that? Why do they need to take profit? Why can't they carry on raising the price? Why does the price rise? The price rises because of demand. It's like normal economy of scales. When there's demand and there's no supply kind of thing generally then the price will rise. But in trading, this is a zero sum game. It means that for every buyer there has to be a seller.
So if I'm buying one lot of gold, there has to be a seller of one lot of gold.
That creates the demand and then a person will. The price will go up.
So do you understand that part?
Thumbs up, thumbs down. Cool.
Okay, great.
Okay. So they raised the price.
This, these candles here, these are called liquidity sweeps. They, the institutions know that there will be.
Stop losses. So.
Like let's draw it out for you.
Regular size.
Okay. Sell. Okay. So it's a sell order. Sell trade and then there's an slide. Yeah. So the institutions, sorry the retail has placed their trades a cell like there. Okay. That place to sell like there dumb money. The price spikes north.
There is a few buyers here. The banks will buy. They know that the stop losses are at a certain distance. And then they will then close those trades. The stop losses will be hit and then they'll close their bar trades as well to other buyers or other sellers. Do you understand that point? Yes. No, I Know, it's difficult to like understand. It's taken me a long time to get it. I can see by the amount of hands that are going up, it's confusing. Okay.
So.
I don't think that the institutions are placing sell trades here. I think.
They'Ve placed big orders here.
And those big orders are triggering. How do we know that? Because the price comes into this order block. So.
Why is an order block created? An order block is created. How do the institutions buy? Okay, so let's say they've got.
40. Let's say they've got 60,000 contracts. Orders. Pending orders. Okay. Pending buy orders. So when the price comes down here at a certain price.
Those trades will execute.
Cool.
So they've got buy limits. Price comes down to a specific price, the order triggers, the price goes north. Okay, so here it is. There's your pending orders. Price comes into here. And only a small amount of the 60,000 orders can execute because they have to be sellers on the other side for you to buy from. So let's say there's only 15,000 sellers of lots of. That means that there is an outstanding 45000 that still needs to be triggered. Price comes up. Now there's 45000 pending orders still here. Okay. Then maybe they've got some pending orders in this area, maybe 15,000 and they're going to hit do the take profits again at.
At this level. They're going to keep on doing a price will get to that level, take profits, price will reduce. They'll. And they just. They scalping the market maybe on a 1 minute chart, 15 minute chart, 30 minute chart and they're going to carry on doing that. This is just cash flow, this order block here. Cash flow. Unless we get.
A big order.
A big candle.
In this area, maybe there may start there. We don't know where the candle is going to start. Who knows where it starts. But if we get a big uptake like that, then we know that there are big orders in this area. All right, so far this is a point of interest. There's orders there. We don't know how many orders but they ex. They are executing. Does this make sense? Does this give you a little bit more clarity on what's happening with the charts?
Okay.
Like knowing this information. Okay. It's like a crystal ball, okay. Of like really understanding what these MFs are doing. Okay. And then you can start planning your life. Like.
Let'S do a chart.
Let's do, let's go to a chart tackle.
Chevy's raised her Hand.
Okay, Chevy, unmute yourself.
Thank you so much. Alan, this is sounding like an algorithm of sorts.
A lot of institutions use quant bots. Okay, so there'll be a quant. You know what a quant is?
No, I don't know much about it, but I can recognize algorithms when I see them.
Okay, so quant is a quantitative analyst and he will program a. An algorithm. Yes, you do exactly that. And it'll just take. It'll go to this area. It'll exactly what we've got.
Okay.
He's putting his take profits price will drop entered into this area pending orders execute. Price goes up, take profits, stop losses get hit. Price comes down. And they just carry on playing this game, okay. Until orders are exhausted. Until the day ends and cut data ends. So we were talking about data and why where we are with cut data and why I don't think that there's going to be 40, 000 contracts and I've got sidetracked. But I needed you guys to understand what's happening on the chart for me to carry on with my conversation. Can I continue?
Yes.
Cool. Need water.
Cool. Okay, so let me finish with quad data and then I'll go back to my story about how to use this to your advantage. Martin, write it down. Please remind me. Cool. So let's go back to the chart and you can see that there's a big red candle.
Let's go back to this one over here.
It's just easier to see on the phone.
Okay, cool.
So here it is. Okay. Stopping at the four at the atma. These lines are. They just work like we know that these are the moving averages that the institutions are using. It's like obvious, I think for guys that have been trading me with me for years will agree that these are definitely the lines that the institutions are using as support and resistance levels. And they've got their orders at various different at these moving averages. So to get back to the COT data, why are they not going to be the 40,000 orders? Because if we go back to the phone and we go back to the four hour, it's got it back to the day. Okay, let's have a look here was just maybe not. So let's go from here to there.
Is 162 pips.
It's a little bit long, so I'll.
Do it the other way.
Cool.
I don't know where that candle is, how long that candle is.
It's not.
It's almost there. Look at that. So it may be that distance there is 40,000. It's the same as that. But because they've reduced, I don't think it'll be 40,000. It could be 35,000 and may the price may come down even further before the end of the day.
You must remember that the US is in control now. So anything can happen. And they may create a big red candle on the four hour chart. I mean, who knows? We'll see. Maybe they decide to really sell and we get a continuation down to here or down to here. Then there'll definitely not be 40000 orders. They would have hidden it in clock data. It won't show up next week. And then tomorrow what will happen is, is that you'll get a nice big green candle. All of a sudden there'll be a big green candle. Okay. We won't know why. Now you know why they're disguising it. They're hiding it in their cock. They're hiding it from the public. Okay, these stats, you need to watch them. Okay, so does this make sense? Yes. No.
Groovy.
Okay, so do you have questions at this point? Unmute yourselves and ask questions.
Sorry, can you hear me?
Going back to that other graph you were showing now, how does the white candle appear? Does it appear automatically on our charts?
On the robot?
Yeah, on the side appears automatic. Okay, I haven't noticed that.
Okay, so there, these, these white wicks.
Yes, yes.
Okay. Candle which is adjustable by the way. You can adjust that.
What am I on your demo account? Cool.
And what does that 50 candle mean again?
That's basically means that the body of the candle is 50 of the distance from the top of the week to the bottom of the week. And those are the candles that create order blocks and effigies. It's an indecision candle. And this is where the institutions are placing their orders. Yapping and conspiring against you and then they placing the orders and then all of a sudden it'll trigger.
Okay, so basically can it is it. Can I say that if you spot that and you're in a bullish trend, you can add to your bias because you can anticipate burst up.
Oh, I'm gonna get to that. You jumping the gun.
Okay, cool.
Unmute yourself please.
Thanks, Alan. I just wanted to check.
How'S the. When the institutions are closing their trades before cut data like you said, they, they disguising the trades. Are they actually closing their trades?
So they. Oh, so they're in profits. Are they taking. That's why the price is going down.
Okay, so that's the Method institutions don't close their trades in negative or hedge their trades to mitigate risk.
Okay, so just closing, that's what brings the price down.
Yeah.
Remember that these folks can print money. They put money out in there. So they'll just buy whatever they can and then go to the reserve bank and say, I need more money. And they'll say, okay, cool. Okay, here it is. It's digital. So it's just a lot of. It's for gazing.
It's nonsense. Right.
So they're taking profits. That's what they're doing.
Okay, cool.
So yeah.
Yaku, unmute yourself. Sorry, Al.
Thanks, guys.
Yeah, sorry, Alan, I'm not sure if this is going to be a silly question, but. Okay, so you mentioned cop data is like it's a week behind.
Correct?
Correct, yeah.
Okay, so if the cut data shows that there's more longs than short.
Yeah.
And that is old like a week ago.
Yeah.
So should we be seeing an uptrend in that past week and is it fair to say that we can expect them to continue going longs until we see the shorts are more than longs or is it not really a possible to tell for sure?
It's not possible to tell what we can. There's another way of checking of which I'll get to that. Now, Martin, remind me in my Facebook. Okay, so we can see it on the chart this week here.
Yeah.
Is this week here.
Right.
26 to the second is this week.
So we saw. This is the 40, 000 contracts that they added.
Yeah.
Next week maybe 35, 000. Unless they do something.
Okay, now it makes sense.
Okay, so I basically drew it out for you. Yes. Comparison to the last week.
Okay.
But we can surmise like what's going on.
Okay, thank you.
Yeah. Okay, Everybody on the same page.
Cool.
I want to show you another trick. Go create an account. I don't know why my plugins are not working. So it's both. All my plugins now. Not working.
Okay, cool.
My fx. Let's look at there. Let's go here.
Let's go to this.
Let's go to MyFXBook. Open an account, create an account. Log in on your phone and then you go to the hamburger lines. And then you go to sentiment. And then you can choose what pairs you want by hitting on the symbol and then choose what pairs you want. Okay, so just press down and then.
You can just click whatever you want. I don't want silver. Okay, cool. Okay, great.
Got it. Understood. It's recorded. Don't Panic.
You can re watch it.
Then you mouse over or you click it. And you can see here. Now this is very interesting.
Okay, so normally. Normally. Okay, so the institutions are short. Why are they short? Okay, this is so important to understand, okay, why they are short. So MyFXBook is one of the biggest auditors. They're the same as FX Blue. Okay? So people are plugging in their metatrader fours, and the data is being grabbed and being hoed into the system. And then if MyFXbook gives you this scenario of what this is, this is my opinion, and I don't think I'm wrong. I'm never wrong. Don't argue. Bad idea. So just 64% long. You know what that is?
Do you know what that is? Anybody? Come on, tell me what that is. What? Why are they short?
They want to fill the public.
No, this is the public. Oh, this is the public. So 64 short.
Okay, you confused us there, because you said institutions are short.
So you mean to say the public retail is short. Why?
Because institutions are long and we're expecting them to offload.
But why are they opening shorts? Okay, that's one thing you're saying. So the institutions are very high north. And. And retail is saying, okay, they too high north. Let's open shorts. That's one reason. Next.
Yeah, I was gonna say what Martin says. They speculating because it's an auto. There's no history. So it's like almost like gambling. Taking a chance.
I go, cool. Next. Who's got another opinion?
Trying to balance supply and demand. If short is high, long needs to come a little bit higher to balance.
It.
Even makes sense. So short is high, long is low. In order for that to balance, long needs to increase, short needs to decrease.
Okay, Interesting statement. Okay. Chevy is an analyst, by the way.
Product analyst. I mean strategy, not money.
A strategist.
Yes.
Okay. Anybody else got an opinion?
No one?
Okay, cool.
Blow your mind.
That's what that is.
These are bots.
These are what you call.
Bots doing the wrong thing.
Okay? They are. They've got their EAs that are opening shorts. And I would say that 95 of the people retail are using DCA bots because that is the bottom to use, because that's how we've been trained. Institutions are dcaing. We might as well. But the problem is that they just. They don't. They could. Yeah. They don't have a clue about data and what the institutions are doing. They just don't know. That is just dumb money. But I think that Is ea. Those are EA trades. That's what I think.
That is.
Because every time the price goes up, shorts increase. And the only reason it can increase is if the EAs are placing shorts because it's the opposite to what our robot does. We don't have shorts activated. That's how I work this out.
Okay. As our price comes down, the robot is opening buy trades.
Okay? But they. What they're doing is that the price is going up. And because the price is going up, the robot has opened a cell and then dollar cost averaged another cell, and dollar cost average, another cell. And then it's just DCA ing these cells until they run out of equity. So when will they run out of equity? When does the institutions.
Change direction? Usually they change direction. I'll take your question now, Martin. Usually they change direction at between 65 and 85%. That's when the institutions change direction. So we're not there yet.
So this is another indicator that the price is still going to go north. Not today, because it's the end of cot week.
Not bad. I don't want that confused.
Okay.
Oh, God. My mother still harassing me.
Right. Okay, so that's that.
Let's. I don't want that. Let's go back there. Cool.
All right. So that's what's happening with the chart.
Okay. What else did I wanted to tell you? Ax? Martin, what did we write down?
So how to take advantage. How to use this information to your advantage.
Sorry, say that again.
How to use this information to your advantage.
Okay, before we go, there's. Anybody got any questions relating to what I've just told you? And do you find this interesting, what I've just told you?
Yeah. Rajiv's got his hands up.
Cool.
Alan, you said you know the market's changing when 65 to 85 of what?
What?
65.
85%.
Sentiment.
The sentiment, yeah.
Okay, cool. So when this number shorts. When shorts goes up between 65 and 85%.
So if it's 85%, then long is 15%.
Oh, okay.
Okay. Yes. So it's the amount of shorts that they have compared to their longs. When we get to about 65 to 85%, we know that the institutions are going to create a liquidity sweep. They're going to close out all those shorts, they're going to close out their longs, and the price is going to drop. Not a reversal. We can never tell what when the institutions are going to reverse. We. We don't know. We don't know what they're Doing? All we know is that Venezuela added like 55,000 ounces of gold like last week. Well, how much? 50,000. Like the institutions and the countries are. They're going back to either the gold standard or.
Like we don't know, they're hedging against the dollar because they don't trust America. Like it or hate them. I actually run the economy and I just.
So our question and no business.
You were saying that supply and demand. There has to be people selling gold in order for us to buy gold. Do the retail shorts count as some of those cells, those DCA trades, does that allow them to place more longs when bots are placing shorts?
Yeah. So when they're buying, somebody needs to be selling. So those are shorts. So chomping up those shorts from retail again. Who is retail? US and smaller hedge funds like the.
Sunlam. Okay, not moving the market. FNB not moving the market with a.
$5 million.
A month that they buying gold or whatever it is and trading forex. They're not moving the market, okay? Not globally. The only ones that move the market are like.
Like the old.
Lehman Brothers, Stern, what's it called? Lehman and the big boys. J.P. morgan, J.P. morgan. Okay. Bank of America. Like those oaks when they place their orders, that moves the market.
So Paul, I see your hands up, but we can't see your video. So if you're there, just unmute yourself and then Chevy's got a hand up again. Chevy, I'm loving your engagement. It's brilliant.
Very good.
Thank you.
You can unmute yourself.
I'm waiting for Paul, but I'm also happy to chat while Paul is getting his, I think, unmuted. I'm so sorry for the dumb questions.
I think there might be a few. Alan, but does this. Is this correlated to why you said we should expect a green candle tomorrow?
Yeah.
It's not the supply and demand that has to match. They're hiding their orders.
Yeah.
Don't want the public to know what they doing, okay. So they disguise it. And the only way they can disguise it is only on a Tuesday.
Okay.
Close their positions so it doesn't show up in the cut data that the audit that's coming to the public because it's public knowledge even if it's a week old, even if it's a week old knowledge to become. They don't want the Institute, they don't want the public to know in other institutions to know like what they doing.
Okay, but the based on this, the general public and the smaller fnbs and that can expect more longs to balance the shorts.
Why do you say that?
So.
Just looking at the screenshot, 36 long and 64 short, and you made a comment that supply and demand need to be balanced. And you also mentioned that we need or we can expect a big green candle tomorrow. So I'm just trying to connect the dots to understand for myself what is going on. Again, I am super new. Like, I'm still learning.
I'm saying in general.
Okay.
General. It's a general.
Okay.
The past. What I have found.
Yeah.
Is especially on a Friday, there'll be a big spark.
Okay.
Down or up. And then on Monday or Tuesday, they'll reverse it.
Yes.
Opposite. They'll just make up that gain again. It was just to get rid of or hard depositions. One of the two. Yeah.
Yeah. I've noticed it a lot on a Friday, but now I'm starting to notice it on a Tuesday.
Okay.
And now we know why. It's because of cut data. So.
That already is like 25%. 10%. About 10%. So 40,000. 4,000. Yeah. So 36,000 longs, maybe. Unless the price sinks even further. And then it won't be 36,000, it'll be less. So now we understand what. And I think it's something to note that this kind of a move is 40,000 lots. So I think it's something that we need to be documenting and saying, well, if that's 40, 000. If that's 40, 000 lots added.
We can now work out what kind of move will be X amount of lots.
Sure.
I've jumped straight into the masters here.
Lots of pallets. It's a lot to palette.
So check how the new candle that opened just bounced off the atma.
Right off. Huh?
Straight and check. RSI's just dipped under 70.
Yeah. So I'm still convinced on that RSI. I still believe it's a lagging indicator. So let's chat about the RSI while we're here. Here's the thing. King of the rsi. Okay. So let me get a pen.
And then if we've got time, just chatting about the 8 EMA. I see Majimetra is on the call. Maybe he can just give us his take on it quickly because he's done phenomenal.
Yeah, absolutely. So this is what has to happen.
It needs to go over there, touch the 60, and then it needs to dip. When it starts dipping.
We now know that we are in a bearish phase. Not a reversal, just a bearish phase.
And that is when they say you should be opening up shorts but not on gold. I just don't want to be opening trades up on gold before we get to muddy. Major, you wanting a testimonial or what are you wanting? No, no.
Just about the eight ema. What his take is on the. On your strategy around the atma.
Stuff. And Martin can ask his questions just.
Before you get there. I'm getting questions about your uptrend and downtrend settings, so maybe you can clear that up for us quickly.
Based on that, Oaks, I've added new presets that just been loaded onto your machines. Okay.
Load.
Right. There are new presets for everybody. If you're new and you've just started, then you need to be using the training wheels.
Presets. Okay. C1 is chart one, C2 is chart two, C3 is chart three, and C4 is chart four. How I do that is I open my chart and I put them in order. 15:30, 15:30, chart one, chart two, chart three, chart four. Okay, here's a little hack for you. Okay, so if you're a newbie, you open up, you load the preset. So let's just load a preset training wheels, C1. I'll go through the settings now and preset used. Double click here. You can say chart.
Chart one and put in whatever information you want there. Just so reference so that when you on the preset, you know what preset you're on. You don't have to like mess it up. Okay. Training wheel presets are money management set to manual at 0.01 lot size so that you can start getting a hang of it. Okay. That's what the training wheels is. And then when you're more experienced, you can load one chart on maybe yaku settings with a money management of 0.202. And then you need to go through the inputs. Training input settings, training videos that explain the inputs so that you can understand what everything is. Otherwise this, you know, you need to understand what's going on. Like, seriously, it's like you don't.
It's like electricity, you know, you need to read the manual kind of thing. If you don't read the manual, electrocuted.
It's very simple.
Okay, so that's the new presets.
Right? Mari? Major, you want to unmute yourself?
Yeah.
Good evening, Alan. Thank you so much for putting me on the spot today.
Yeah, not me. I'm Martin. Ask your question.
Yeah, it's just exciting. Learning curve. You know, Alan knows I've been very stubborn since 2023. And eventually I blew my accounts. I got frustrated. I said, never let me. You know the story about my boss, he's still undecisive. So I embarked on this journey basically to prove to myself.
Oh wait, hold on. You phoned me in Dubai.
Yeah.
So when I bought the learning how to read forex chart, I went through it and then I implemented immediately the Atma crazy stuff. So to cut the long story short three months, I was able to grow my account by 45. So that's an average of 15 per month manual trading. So now there isn't spike, there is not move on gold. I was very excited. Now I became the, you know, the retail thinker of me. Emotions kicked in, greed kicked in, excitement kicked in. I saw my RSI. That was before I understood your teaching that RSI is actually reactive. So as I going beyond 70, I said, no, no, no, these guys are gonna come back, let me start selling. I started selling and then I call it those, what we call this term, dollar cost average. It went on and it kept on going north and here I'm south. I eventually said, no, let me give up, go back to the course again. Just relax and take my time. So yeah, Basically, yeah, for three months I was able to grow my account by 45. But now it's a mess because I the current north move was going against my instincts, my emotions. So I'm kalma learning and then. Yeah, quite beautiful. Check me, you know, check me. By December this year you're gonna be seeing flames. But for now, this is beautiful. Alan, thank you so much.
My pleasure. Well done.
Ask you quickly. Yes.
After having burned your fingers a little bit now, how do you feel about the strategy with second candle above or second candle?
It's crazy.
It's crazy to a point that, I mean, I was doing the stats, I just forgot. I forgot my notebook on downstairs where I looked in July. Every move on the second candle on ema. You know, if we just displaced our. I'm still on manual. If I only place my trades on second candle above EMA, great money. And even for my 25 growth in three months, when I go back to check, it's exactly that 8ema is crazy in Pretoria. I would say that's my waza is crazy. If we just stick to that, we will make a lot of money. What are you doing?
Are you working for a doctor?
Yes, I'm working for a doctor. He has a bit of some money, so the idea is for him to do the robot because he's Quite busy. So we're still figuring out, but now with my account being a bit in a mess because I wanted to show him to say, look, for three months I've been learning and doing this thing. Look at my results. I know he's not talking about himself and the fiance. They're talking about 8% per year. You know, the fiance's dad is actually a former old mutual financial advisor. Now there I said, no, I'm just gonna, you know, prove himself to say, look, you are wasting money there. Come into this thing and then see what it'll do for you.
Yeah, thanks so much, man. Speaking to lady today, she's like in a.
Is a chain.
She invested bucks with one of the institutions. And she said, like, for 25 or 30 years she's had negative growth.
She says, like, what a con.
There's a reason the guy who comes to your house to tell you where to invest your money is called a broker because his job is to make you broker.
I love it. Okay, cool. So.
Right, so we'll see what happens later today. Who knows? Okay, cool. So what was on the. What did you write down? Okay.
When do we take advantage of it? Sweet.
Right now, knowing this knowledge, having this knowledge of cut data and what the institute institutions are doing, and then understanding a little bit more about order blocks and supply and demand zones, when would be a good time to increase your risk?
So this is 3550. There's an order block here. This is a supply zone. Why have I got it as a supply zone?
That's not a bloody supply zone.
That's a. For our demand fib.
Cool.
Okay, so we've got one at 3599. And we've got one at 355-335-9923585. Cool.
So let's go to the phone.
3599.
And.
It'S like there.
There's an order block, a demand zone. And let's do another one.
Actually should be plotting this, not sitting doing nothing. And then three, five, nine.
Okay, that's that one.
Three five, five eight.
Three, five, five, eight. So it's over here, it's there.
And then the other one about there.
Right. Now, when you draw order blocks, okay, they always approximately the same size. You don't get massive order blocks. Okay. It doesn't work like that. Like, I've drawn this one. I not sure it's right because it's bigger than my other ones. Okay. It's like double the size of the other one. Generally they're the same size.
Now that's very interesting to note.
To see what the institutions are doing, you need to look at everything. Okay. And ask questions. Why is it the size? Why did we draw it like that? Why isn't it drawn somewhere else? And ask these questions. But you need to observe what they are doing and just take note of it. So we know that they are. Now the reason this one is a little bit big, the big guy, is because we've got all these 50 candles here. Theoretically it should be there. Then it's the same size. Do you see that? But I've included it because of these 50 candles here.
These ones over here. It's like there at the bottom of.
Come now.
Like at the bottom of the doji. Okay. And it usually stops not at the top of the wick, at the top of the candle of the doji. Okay. So I've included it because there are these 50 candles here. And it's weird. So I know that this is different. But we'll see. When will we see?
We'll see. Okay, so.
How am I going to do this?
I'll do it like this. Where did I take it from? From there. 3667. Okay, cool. We'll do it like that.
Sweet.
Sweet. Gender. Amen. Come on.
Sweet. Okay, cool. Look like that. Okay.
I need to retake my chart.
From there to there. Great. And then we'll take this and we'll copy it across to there. And then we'll move it across there.
Great.
And then we'll make the background black.
Right?
Thor black. I don't know why it doesn't do it anymore.
I just don't know why it doesn't do it. There we go. Okay, great.
Okay, so now we've extended the chart.
Lekka.
Sorry.
El Miguel's got a question I think.
Can I ask and I'm sorry, just remind me how you draw those. How do you spot those? As the key levels for the auto block. And the other one that you drew on top, how do you spot those levels? And is this on the forward time frame?
Yeah, it's on every time frame. But I read the chart on a four hour time frame. Most traders read it on a four hour time frame. I'll teach you some tricks now. Now just remind me, Martin, about scalping on the 15 minute and lower time frames. So how you do it, okay. Is you're supposed to draw it. I don't draw it accurately. I'm not interested in being like micro trader and flipping pedantic about where to draw the lines. It's like, I don't have time for that shit. Okay. It's like an average. It's like roundabout. It's roundabout there. And then when the candles come down and they go a little bit further, then I'll adjust my order block. You've seen what I do on the Ellen Trade.
Discord channel. Okay, so it's usually from the bottom of the candle to.
The high of the wick. But because there's a doji before this doji, a spinning top, I've drawn the other line because this is the point of interest. And there's another doji there as well. So there's a doji there. A bit of a retracement. Okay. Then the doji, and then the price went up. So we know that something's cutting in this area.
Answered.
Yeah.
Okay, just one more question. Does that become like support and resistance?
Or let's say is support. The price will come down here today. It'll be support because they've got orders here, pending orders. Remember this sheet over here?
Yeah, yeah.
Copy it.
Cool.
Is this movable?
Thank you.
Okay, you got it. Okay, cool.
So I'll just put it down there. Okay, so they got pending orders here. They got buy limits here. They've got the price comes down below. Then they've got buy stops. So it comes through this area. There it is. Okay. A buy stop comes through the area. And then when it comes back up. So it's got buy limits down here. Then when it comes back up the buy limits, the bar stops, also trigger and the price goes north. Understood?
Understood.
Thank you. Oh, great.
Okay, let's just make black again. Sweet.
Okay, so the question was, how do you use this to your advantage? Let me show you the trick. How I place my trades. And when I decide to switch on my robot.
Do I have a thinner one?
Just scroll to the bottom.
Okay.
So could be one candle.
Oh, gosh.
With.
Okay, there we go. Okay, let's add.
Do that.
Just want to position it so that I can use it. Give me one second.
Is that it? Yeah. Okay, cool.
Okay, so price comes down, and then the price comes down. Yeah, let's do it differently.
Gosh. Okay, let's just draw a nice candle.
Let's draw a candle. This is candle one. This is candle two. Okay, here's the eight ema.
Eight ema.
Now the price is below the eight ema. And we've got here.
Candle one below the atmo. Candle two below the atmo. All right, then we get.
Then we get some More candles.
Come now.
Okay, There we go.
Then we get some more candles. Red candles. It's got weeks. Obviously. Comes down. Okay. Comes through the price. Okay. Then the price retraces.
The price retraces. We get a little bit of a wick. Okay. So we know that the orders in this area and the atmo is catching up because it's. The hours have gone past.
And then all of a sudden the price goes bossies. Because we've got orders here. Hopefully it doesn't. Hopefully it's too soon, too near to the atmh. Okay. So I'm gonna carry on drawing my candle.
Okay. Get another candle. This is what I'm hoping is going to happen.
Okay.
Candle into here, into the order block. Get another wick down.
Cool. Okay. And then the atmo is catching up.
And then we get. What do you think is going to happen next, Alex?
You're going to shoot up, huh? It's going to shoot up.
Price is going to go north.
Okay.
Sometimes anybody else got in another opinion?
Come ask, think.
What's this called?
Dodgy.
Right. What's the formation called?
Morning Star.
Thank you.
Morning Star.
Right. The robot made a boy.
Okay, so there's. There's the atma.
Candle one.
And then. Can I just quickly ask you a question?
Yeah.
While the red lines are dropping, your robot is off, right?
Yeah.
You only put it on when you.
See that formation or the.
Obviously the candles closing above the a. Yeah.
My robot's off on the way down.
Yakut is on.
Mine is off.
Yours, yours is more high risk.
I understand. Yeah.
Okay.
It's a different strategy, that's all. This is candle two. Candle two opens above the atma. Okay, we know that we're in an order block. What does Alan do? Alan switches on his robot and changes the risk.
By using.
My calculator.
So I know that I've got. I don't know.
I don't know what I got.
43. I don't know.
43 grand.
What is it?
46 grand.
Okay, 46,000.
It won't be 46,000 because of the big drop. So we'll say 40K. We'll say 35K. Yeah. $37,000. $37,000. And I'll put a risk of one. Now, I know that my robot's going to open a 3.7, but if I'm on that order block, could Increase it to 0.15. Clock. No more than that. Okay.
Like, you need to be. You need to know what you're doing, and you need to understand what the risk is. Okay, so let's do risk. Important.
What's the price? What are we talking about? If the price goes from 3, 5 4, 2, we put in here.
Three, five four two.
Four two is the price. Okay. And I've got $37,000 in my account. And the robot is opening a original lot size of 5.55. Can't just be stupid. Got to use the calculators and the tools that I give you. Okay. What will my drawdown be? It's five, comma.
Wish I could fix this problem.
Okay. Wow, that's a smashing.
So that's if the price went to 3,000. Is the price going to 3,000? No, I don't think so. So let's just.
Let's just scroll. Let's just create another picture here.
How do I do this?
I can't. I need to go to my phone and shrink it. Cool. Okay, cool. Sweet.
Really?
$3,406, approximately. It'll go to 3,400. Okay. Right. So I'll go back to the calculator and I say here, if it. If the price drops to.
$3,400.
Copy that. All the way down. What will my drawdown be? On one chart, 16%. Now I know.
What the risk is.
So now I can say, okay, well, where do I want to hedge? If it goes south, where do I want to hedge? So let's go back to the picture and let's go back to here. So if the price, if the second candle opens below the atma. Okay, I need to immediately, like switch off my robot or close those trades out in a loss or hedge. Those are my options. But I don't want to be opening sell trades because my luck, the robot will flip and open two trades here. Okay. And then the banks will get involved in the bloody place. A nice big green trade and they'll go north. And then I'll have a sell trade here. So I need to. You need to be very careful. I don't want to be placing sell trades.
Now here's the conundrum.
During December, from October to February.
Let's go look at the past. Don't rely on me.
Month. Let's go look at the past.
September 2017 is too much.
We can't do it on a monthly basis.
Can we do it on a monthly basis? 2021.
Can't really do it on a month basis. Let's do day charts. Okay.
June.
April, March, February. Okay.
February.
December 2024. Here we go. Okay. So there, look.
From November.
To January.
So what is that.
That's $204 retrace. Okay, so now that is basically what's the percentage drop from the high here?
So if the percentage drop was, let's say it doesn't tell you the price.
So we need to drop a goody here. And it'll tell you the price.
27, 86 2. Can somebody work out the percentage, please? Because my math is.
Okay to 25. What is the percentage difference?
That's about 10%.
Exactly.
It's about 12%. Okay, call it 12%. So if the price drops.
If the price drops now 12%, what is that? So it is just over $300.
360 will be $10. Sorry, what is the price on the 350?
3.
5.
So 350 will be 10%.
Let's say the price drops to the order blocks of 300. 3, 5, 5, 8, minus again, 350 takes us down to.
3, 2, some 3200. Okay, so now we know what we're doing. So we say here 3200.
Because that's basically what it's going to do in December. So that drawdown now is 44%.
Is it a wise idea for me to be taking big lot sizes at this time of year? What do you think is the right answer?
Go small.
Right. So it's the end of the year. Okay. Banks don't want to hold the trades. They want to also, like, clear out their books. So I don't think I'll be placing big trades at that level. Let's say it wasn't coming into the new year. Okay, so a 5.5 lot, not a good idea. 3.7.
Three comma, seven, even 30% draw. That's on one chart.
Just remember this is on one chart. But what are the chances of me having 30 trades open?
I don't think I've ever seen more than 15 trades open per chart. I don't think I've even ever seen 10 trades open per chart. So if it's 10, then it's 40 trades. Okay, so let's just extend this.
By another 10. 10 trades.
32. 42.
Cool.
Okay. It's nothing. It's not even money.
So my total drawdown over probably the four charts, you can't work it out like that because it'll be double of these. It'll be four times of these. That's what the robot's going to open. It's a bad decision.
But now you understand risk. Was this a good lesson?
Yes.
Okay, so now you can understand what Your risk is how to understand your risk and when is the right time to be placing strategic trades. In my opinion, now would not be the right time to be placing strategic trades. Now if it wasn't this time of year, then yes, February, March, when it comes down here, okay, definitely placing trades. Definitely. Depending. This is a key. Depending on what?
Depending on what? What is another factor I should take into consideration. Data. 100%.
Cut data need to be looking at the cut data need to be deciding, okay, what the banks are doing, what the institutions are doing, what their game plan is. And then we can start and then I can start to say if they cooling drastically then I'll need to think about it. Seriously. Now there's something else that you need to look at with your data which is your 13 week moving average. Now the 13 week moving average is a financial quarter. It is four months.
What I have found is that when the holdings are more than the 13 week average, the institutions start to release their long positions. So we're now above the 13 week average by I don't know what percentage, but it's over.
And it'll be interesting now to note.
What kind of longs they add now or return. Reduce their longs by what kind of a percentage? If it is it relevant if or relative to the percentage difference, which is the next thing that we'll look at in the next couple of weeks. But what we do know is that when this is more than the 13 week average, they start reducing their positions. So possibly they could be starting to reduce their positions or they'll carry on increasing their positions. And if they do increase their positions, what do you think is going to happen to the 13 week moving average? It's going to increase.
So then it won't be above the 13 week moving average anymore. We'll see. Maybe the 13 week average moving average has to catch up. It's another thing that we need to think about. Okay, so if another week goes by again they drop it by like 5,000. This number isn't going to be 278 anymore. It's going to be probably 280, 290. It's closer to the 315.
Do you have any questions?
Do you now better understand cut data and how it's relevant to the training charts and how it's relevant to when you should be opening and closing positions.
It's like just a giant piece of the puzzle.
Absolutely, I think so. I think it's massive. You guys want to unmute yourselves and share some thoughts?
Anybody?
I believe I'm sick again.
That's the third time this year.
I just have jumped into Masters.
Yeah.
Continue.
Of course not.
I want to explain, and I say this in a lot of my video.
That.
I learned something a while ago was one of my first seminars I ever went to, seminars I ever went to with a guy by the name of Marcus Setter. And he said there, like, this was like halfway through the seminar, it was in the morning, and he said, this information is not for all of you. This is only information for some of you. Because for years, and you've heard this many times, and then you'll pick up one or two tidbits. This makes sense. Some of you are on the halfway line.
Some of you aren't in the stadium yet. They're in the parking lot. Some of you aren't even in the same suburb as me.
Okay. And some of you aren't even on the same continent. And that is okay. As you start hearing the information, you start picking up and you start learning. And even if you learned one thing tonight, it was worth you being here and I appreciate you.
Thank you, Adam.
So do you guys. Did you find it valuable?
Yes.
Thank you.
Okay, cool.
Any questions before we head off? It's a long evening.
Anybody got questions?
No? Okay, cool.
Then we'll leave it there. And then if you guys have got other things that you wanted to discuss, you can just ask on the strategies group. And if we need to have another Google Meet, we'll have another Google Meet. Cool.
Thanks, everyone, for attending.
Have an awesome evening.
Thank you, Martin. Thank you, guys.
Cheers, guys. Bye.
More from Alan





Double bottom forming - Gold ready for $4000 #trading #technicalanalysis #xauusd





