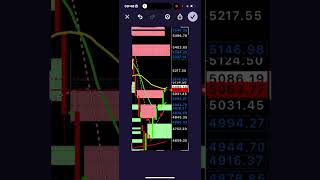
Technical analysis of 1-hour and 4-hour charts shows the 50-day and 200-day moving averages converging as a key reversal point. A break above the 30-day moving average supply zone and doji formations suggest the dollar could weaken and gold could rise, with price targets in the low to mid-40s.
Chapters
Morning traders. Right, let's continue. So as you can see here, we're now stuck on. I don't know why I do that. We're now stuck on the 200 moving at the 50 moving average over there, which is the 200 moving average on the one hour chart. So this is a four hour chart. So let's mark it. There is the 50 moving average. Can we make it thicker for you guys? Styles? Yeah, thicker. There we go. Can't make it thicker. All right, cool. So let's go to a different time frame. Let's go to the one hour chart. And you can see here, look at that. There is the 50. There is the 200 moving average on the one hour chart. This is a key, key reversal point on the chart. Okay. We don't know what's going to happen here. There are DOIs there on the one hour chart, which is significant in an uptrend. It signifies a reversal. So we've got the DOI and we've got a hammer. Okay. But the challenge with a hammer is that it's red. So that is negative. All right. So we need to take that into consideration. I would want this to be a green hammer. And then I could say. That's interesting. Possibly, if we make it green, right? If we make this green over there. Okay. Possibly I could say to you, yes, the price was going to go north to mitigate this. This, it's not really a. It's almost like a dragonfly doji in actual fact. Okay. More than a hammer. So to mitigate this, we need see the price go above the high of this Doji, then that Doji and the hammer or dragonfly doji has been mitigated. So it's a little bit concerning where we are. I said you that the price could drop and we could go to levels of 44, triple 49 or even lower to, let's see, 43, 4400, maybe even. We don't know. We're just waiting. So it looks like that demand zone, sorry, that supply zone has been mitigated. I'm talking about this supply zone over here. So it's broken, which is great. And we've broken that level. We're sitting above the yellow line, which is the 30 to moving average. And possibly now the price is going to go up here. We have to wait for the Dixie and see what's happening on the Dixie. And we still stagnant. And there are dois. Okay. Which is also really reversal signals for the dollar, which means that the dollar is going to lose strength. And could drop, which means that gold's going to go up or they are accumulating positions and the dollar is going to pump and then the price is going to go to the 200 moving average over here. We don't know. We have to wait and see what the institutions are doing. So it's not really a time to be risk on because I think the dollar's in play, which nobody talking about, so just take that into consideration.