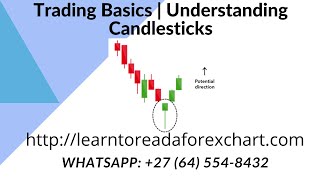
A short YouTube tutorial by Alan Solarsh explaining basic candlestick chart reading. The video defines a candle's parts (body and wicks), explains that green candles indicate bullish moves and red indicate bearish moves, and shows that candle duration depends on the chart timeframe in MetaTrader 4 (examples: H4 = 4 hours, M30 = 30 minutes).
Chapters
This video tutorial explains to you what a candle is. So over here you can see that we've got these written white lines. These are called candlesticks. I like to read my chart using candlestick analysis. So just to understand what a candle is and how it's broken down. Very, very easy to understand, let's go through it with you. Okay, so here is the body of the candle, which is this little green block over here. And you can see that there are.
Two little lines on the top and.
The bottom of the candle. Those are called wicks. So the bottom of this green candle is where the price, where the trade opened or where the candle began rather. So the candle began at this point.
Maybe the price went down a little bit.
That created the wick. When the price goes back to the.
To where the, the candle originally opened, a line is formed from where the last, the, the, the, the low that the candle went to. And, and then when the price goes up further, it may go to a high point. That would be the top of the small little wick.
And then when the price retraces back.
Down and the candle closes, a body is then formed of the candle and then the next candle will open. So for me, a green candle shows a bullish move and the red candles show a, a bearish move.
So which means that for green it.
Means that the price went up.
For red means that the price went down.
So here, in this instance, the candle opened here, closed over here, a red candle, the candle opened here and then.
The candle the, closed when the price reached this point over here, which means that the price went down. Very, very simple to understand.
So what is a candle and how long is a candle? What's the time frame of a candle? That depends on, on the time frame.
That you set your MetaTrader 4 application up to.
So on my chart I've got the.
H4 which means that each candle is worth four hours.
So every candle is a four hour period. Now if you click on the H4.
You'Ve got different time frames that you can choose for. Let's say we choose M30, which means that it's a 30 minute chart, which.
Means that each candle is, is a.
30 minute time frame.
So that's how the candles work. Now you understand it. I hope that you like this video. Please, please like and subscribe to my.
Channel so that the YouTube algorithm sends.
You videos that are pertinent to the.
Subjects that you're interested in and also comment on my videos. Tell me what you want to, what videos you want me to create for you, and I will then create videos for that to make you content.