Alan Solarsh breaks down how institutions trade using chart patterns and moving averages. He spots a bearish pennant, watches the 200 MA at 3368, and explains where to wait for buys at demand zones instead of chasing moves.
Chapters
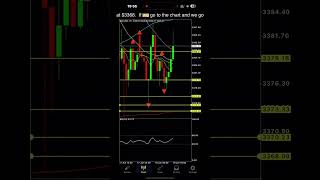
Okay, let's put the camera on because you can't see me. So I'm Alan Solosh, master trader ambassador of fbs.com and what am I doing? I'm cooking dinner as well as trading. So let's show you the charts and let's check what's happening on the chart. So as you can see, it's very interesting times with this war pending. War with the us, uk, France, Germany wanting to get involved. Who knows what's going to go on there? But let's talk technicals. So what we have on the chart is we have a bearish pennant. I'll draw it for you. Okay. It is a bearish pendant. It's a falling wedge. And I don't use this technology. I use candlestick analysis and moving averages. So what am I seeing? I'm seeing that we're still south. So there's been a clear bounce off the 50 moving average over here. Now, the 50 moving average is the 200 moving average on H1. So there it is over there, 3368. The red line at the bottom here is the 200 moving average. Okay, can I draw? Yes, I can. Okay, that is the 200 moving average on H1 at 3368. If we go to the chart and we go back to H4, you'll see here that 3368 coincides with the moving average. So. So why is this significant? Because these are the moving averages that the institutions trade off as well as their order blocks. So these three lines here. Let me cancel that. These three lines here is an order block. Where does it come from? It comes from this area here, which is where they were institutional demand. And then there is a fair value gap because going up to here. So this whole area here is an area of interest. And we're waiting for the candles to go above and out of this area before we can trade either long or short. What's interesting is the fractal over here and the fractal over there. I'm waiting for the second candle to open above the 8 EMA 8 exponential moving average. So I want 1, 2 clicks, must clear this fractal. Then I'll enter my bars. And even then I'm a bit skeptical. I need to wait a little bit, maybe even wait until tomorrow. Right. So let's look at the chart again. What's interesting is that the second candle has opened above the 8 exponential moving average. And the candle is red, which is what I like. So I want the price to actually fall I want the price to go to 3, 200. I actually want the price to go to 3,000 where the next demand zone is so I can place strategic buys right at north and never close those trades ever again. So unless the institutions change the direction and cut data is saying that they are shorting gold, which isn't happening right now, the constitution, the constitutions, the institutions are saying that they are quite bullish on gold at the moment. So we're hoping to see $5,000 in gold, but we'll see what happens. So like and subscribe and comment on the video and then I'll see you on my next video. Cheers.