In this video Alan Solarsh explains the recent XAUUSD price spike, attributing it to former President Trump's comment about not invading Iran, which triggered a large green candle. He analyzes the move using EMA and ATMA levels, identifies a potential bull trap, and introduces his "blue banner" trade concept—placing trades at psychological levels or when the second candle opens below the ATMA with reduced lot sizes. Solarsh details candlestick patterns (doji, gravestone doji) and a Bill Williams pennant as possible entry zones, while emphasizing risk management, drawdown awareness, and dollar‑cost averaging. He reviews retail sentiment (59 % long, 41 % short) and COT data timing, noting that the recent price action may be hidden in the upcoming COT report. Concluding with a conservative outlook, he advises smaller positions and monitoring of upcoming COT releases before committing larger trades.
Chapters
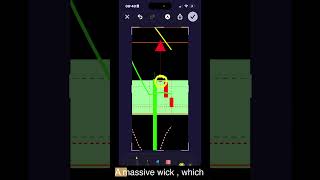
Good morning everybody. So the spike yesterday was due to Trump saying that he wasn't going to invade Iran yet last night. So that's why there's this massive green candle that happened last night. And there's going to be— or it looks like there's a deal on the table, and oil also reduced to, I think, $86. I I saw was the lowest last night. I'm not saying that was the lowest, but that's what I saw, like 86.70, and then went to 87 again. So I said that the candles— we're gonna have 2 candles that are going to open below the 8 EMA tomorrow, which is today, and that this is a bull trap. So we're in a demand zone over there. We have a pennant forming. General direction is north, but I think that this whole area here is a bull trap. So if you're going to be placing a blue banner trade— what's a blue banner trade? It's a trade that you place at psychological levels, or when the second candle opens below the ATMA. You should use smaller lots. So if I was trading this, I would place a small trade, 1/10 of my normal lot size. So if I'm using a 1 lot, I would use a 0.01— a 0.1, sorry. If I'm using a 0.1, I would use a 0.01 lot size, just so that you dollar cost averaging into the asset that you're trading. We're trading gold, so that's how I would play this. Okay, so if 0.01 is too small for you, you can go 0.02. You must understand what the downside is of the trade when you take the trade and understand your drawdown if it goes pear-shaped and negative against you. So that's what's happening. Second candle is above the ATMA, which means that we are north. There is a doji. There is a little gravestone doji over here, a massive wick, which then— so the candle went up and then the price came all the way down, which means that the bears are still in control. So when there's a doji, when the second candle opens above the ATMA and you see a doji, I close my trades that are positive because I know that the price is going to reduce. It's going to come down again. Where would you place your next buy trade? Well, there is a pennant here, Bill Williams pennant, like a good place to place it. Let's have a look and see what's on the left over there. So definitely something happening over here. I would have preferred two dojis before I drew a supply zone, but normally I would place my trade $1 to $2 above the fractal. But this could be, again, it could be a bull trap. Now I looked at the sentiment yesterday. Let's go and have a look at the sentiment of gold. And it was like 60/40 or something posted on the group. I can't remember. Let's go and have a look at the sentiment for gold. Why is there no sentiment? That's very weird. Symbols, here it is. Maybe I should just restart the app and do that again. There it is. So if you click on it, it's 59 long and 41 short, which means that we can still go short here because the institutions trade opposite to retail. So the moment we almost at an equal perspective, but I still think that the price is going to go down. What I also noticed yesterday is that this drop from here— where was it? Let me do this again. Yeah, the 9th of June was Tuesday. Now, COT data starts on a Tuesday and ends on a Tuesday, so COT data ended there. So this whole part of the drop— sorry, this whole part of the drop here down to there, okay, is in— going to be in this week's print, the COT data print. It's not like massive, so we're not going to see a massive decrease of longs. And then let's go back from there to here, and then where is it? So let's put it in again. Where's the 9th Okay, so COT data ends there. So let's drop a line. So COT data ends there, okay, because that's when— that's the end of Tuesday, and that was last week. And then next week Tuesday will be the 16th. So I said that this entire move was going to be hidden. I had a Google Meet yesterday with everybody. So from— so from here down from this to here. This whole area here is going to be hidden, I said, because the price is actually probably going to go back to 4278. That's what I said on the Google Meet yesterday, and look what happened. Because so they hid this entire move here in COT data, which is really interesting. So we'll see what happens on Tuesday, from now until Tuesday next week, to see what the move is, and then we'll know. And my suspicions are that this entire move is going to be hidden. They're going to maybe keep the price here in this area, maybe a little bit up, maybe a little bit down, and then they're going to drop the price even further, I think. So I would be conservative. So that's what my thoughts are, and we'll see you on the groups.