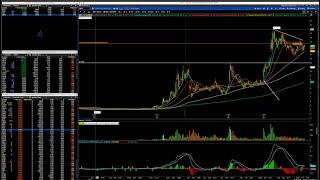
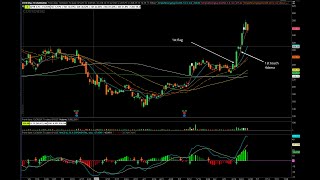
Chart Talk 17 | Length & Quality of Watchlist
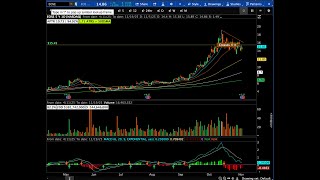
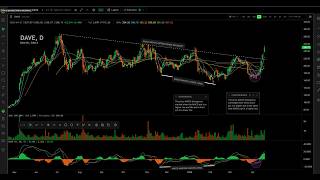
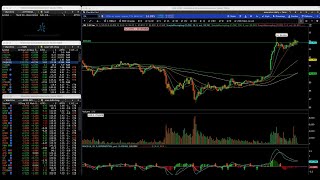
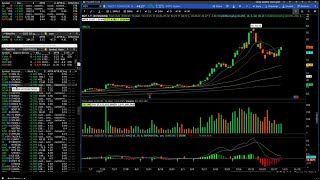
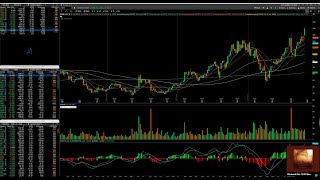
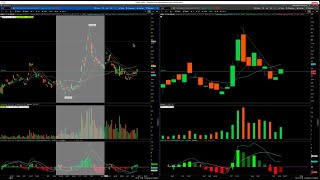
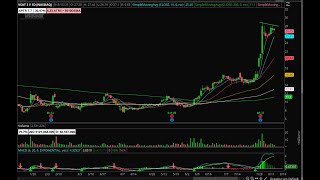
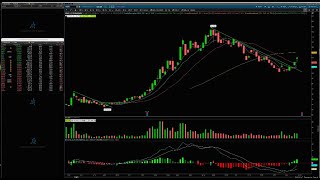
Alec Riffle reviews a live watchlist and explains how the "needs more sideways" list should contain stocks that have momentum characteristics but still need time to form actionable setups in his playbook. He emphasizes rules: each name must have an alert and a clear trigger (commonly a high-volume-close or yesterday's high), and the list length/quality reflects overall market health. The speaker walks through many tickers (LMND, SLDP, LIGHT, QBTS, RGTI, IONQ, PLUG, BTU, SNDK, APLD, and others), judges chart cleanliness, liquidity, and suitability, and grades the market ~2.5–3/5 given mixed ignition candles but many broken charts.
Chapters
You want it to be. You want your needs more sideways list to be a reflection of momentum stocks, that your scan produces the quality of the momentum stock. So if your needs more sideways list is. Is full of stocks making great moves, that's healthy. So when it's like that, we want to find stocks that are actionable, meaning they have tight, tight days, you know, yesterday or the range is tight, they had a big leg up, big linear leg up news, Catalyst Group, all that. So if your needs more sideways list is thin, there's not a lot of names on it that you're tracking well. That's a pretty, you know, it's a pretty strong signal that, that the market isn't that great. Right? Like, like I can tell the quality of the market by the quality of the needs more sideways list. So we're gonna. I'm gonna create a new one right now, and we're gonna literally start from scratch. 1105. I don't even want to be influenced by what's on it. So like, imagine I just woke up out of a coma and all I remembered was my system. I gotta rebuild. Gotta rebuild everything. Heaven forbid that happens. But why can I not make you smaller? Okay, where'd it go? Voila. Okay, this thing's making a crazy move. I looked at it earlier. I was gonna put it in the. The small cap chat. I saw it like right here, man. Okey doke. Okay, so what stocks should go on your needs more sideways list? They're stocks that bear chart patterns that could meet a setup within your playbook, like in the relative near future. So establishing the benchmark for what belongs in your needs more sideways list is good, but I think or is necessary, but I think like, you know, just from like first principles, it would be stocks that needs more that need more sideways to be actionable to meet a setup that's in your playbook. So my. My playbook is all or comprises all of those setups that are in the left nav of our discord that say long setups. I mean, those are basically all of my plays. It's actually funny, this lemonade right here, it looks like it had back in 2024, it had an earnings candle and then it put in a high tight flag and then it went. So that is a continuation setup. That's a high tight flag setup for me. So I think that lemonade breaking out of this big base would definitely go on my needs more sideways list. There is an actionable setup tomorrow on it, which would be an undercut and rally back through Today's high volume close. It doesn't have to happen tomorrow. It can happen, you know, five days from now, whatever. But buying it through that high high volume close is perfectly fine. So I'm gonna put it on my needs more sideways list because regardless, I'm going to be stocking it, I think like nearest high. Did it have the highest volume ever? Probably what I'm just gonna say it did. It's close enough. And breaking out of this big old base. Sldp, same thing. It's gonna go on me. Needs more sideways list. Savage volume. Highest volume ever. 50 move today. It's holding the neckline and afters like that's, that's gonna go on there. Like it's showing like these, these charts there are exhibiting the highest amounts of momentum in the market. Super strong moves. Not selling off. You know, when the majority of traders think the market's up too high, you know, we sell off for three days and you know, from all time highs. And we're getting moves like this already. That's awesome. So Sedgwick, there's no like, there's no like setup here. Even though it had like a really big candle today. This wouldn't be a stock that you or myself would trade. It's just far too choppy. It's not linear. It doesn't really have clean setups. It doesn't make them yet. That could change. You know, it could, it could just rip and put in a really clean high tide flag. But it's not one that's going to go on my needs more sideways. Listen, light definitely could, definitely could. Highest volume ever. Kind of the same story as SLDP element. This one looks good for a small account. Today was like the day to buy. It's, it's just so damn thin. I mean it traded 14 and a half million shares today. It's just super thin. This one's thicker. It's sloppy. It's proven that it can make really big linear moves out of patterns that we trade, you know, 100 in 10 days. That's amazing. It just needs to set up more. It does truly need more sideways. But it's not even close enough in my mind to like actually add it to my needs. More sideways. Listen, there's just no clearly defined range, that's all. So I mean we can set just an alert just to remind us of its existence. So I'll do that just randomly. What is that? That's 2028. Yeah, sure. Okay. Okay, cool. So that'll just remind me of its existence. And at this Time it would be above all the, all the moving averages. Did this thing have an offering? Yeah, it did. It's holding up. I mean I would want it to set up some more, but it does have a level that you could buy, which in my opinion would be back to the high volume clothes. It's just today's close is not very close to, to that line. It's not too far off. What is that, like 20? This is a super, super high ADR. Name it. This is all robo trading. I mean I'm not really interested, interested in it. That's 10 away. I'll set an alert on it just to kind of take a peek, but it's not gonna go on my list. Can you guys hear me? Okay, just want to make sure before I realize that I've been talking for an hour and nobody could hear me. All right, So like this is just an MU, a micron 2x ETF but it made all time highs today. So as we're going through our, our watch list, we want to be mindful of, of stocks making new highs or new advancements that are, that are strong. They may not make our needs more sideways list. Like for this thing to set up in me and us long, it, I don't know. For, for me it's just up way too much. It's up 400. It would need to flag and kind of go sideways for a while. I want to catch them when they're, when they're down here or that first continuation. But like you notice like after the first continuation, like the first leg very clean, 100% 15 days, no headache. Second leg still pretty clean. But then it starts getting choppy, choppy, choppy. Like as the moves progress, they kind of start falling apart in terms of how clean they are. You know, remember we want like headache free periods where it's just like one day up in a row after another. Like we don't have these like big kind of frustrating, you know, like panic dumps back to our average like nasty retests. Like the best stock, the best trade ever is when it literally breaks out. And it never retests. It just goes like that's what we want. So this one would have been on our radar because of how clean this leg was. It was just so nice. Like every single open is higher than the day before. It's just super duper clean. You have this first flag, very clean. And then it built this bigger range and then what we can expect the same sort of, same sort of move. But this isn't Going to go on my knees more sideways list. But I'm going to like take a pen right now and I'm just gonna, I know that there's 200 names in my list. I'm gonna just do a tally and that tally is for a name advancing and it's strong as hell. Going higher like iron. Same thing. Like I can't, I'm not gonna buy it now today. It's, it's right ahead of earnings. But I mean that is a strong ass candle and a name that's up a lot. So that's another one. This one like I don't know, like it could end up on my needs more sideways list tomorrow. Like it's. When do they report the report in the morning. They report tomorrow afternoon. So I'll be watching it anyways. There's I, I don't really need to give it any attention right now because I'm not going to buy it. Yeah, I'm not, I'm not gonna buy it until I guess that would be what is tomorrow. Tomorrow's Thursday. That'd be like Friday morning. You know, Friday at open potentially could buy the, the EP gap depending on what we see. But yeah, like just to remind myself, I'll set an alert at 80 because it's not going to be a much of a, an earnings move if it doesn't break 80. And that'll just kind of remind me of it. I tried to buy this one today in the small account. I think it ended up costing like 30 grand or something. This one's setting up really well. It made a huge linear move. 228 days it had an offering here and now it's just springing back. That is strength. That's strength in a speculative name. You know, if like we were at the top of the market and like, you know everything's gonna start falling apart and you know, stocks are going to start losing the 200 and we're gonna go into this, you know, cyclical bear or something like you're not going to see stocks like this just rebounding. You're not going to see these earning candles. A really good exercise would be to go back to Q1ers earnings reports for 2022 and you would just, you just see so many ignition candles getting stuffed. And then Q, Q2, Q3, Q4. It was like the entire year earnings just getting stuffed. And a lot of you guys have never traded in a period like that. I started swing trading actually January 2, 2022. That was like, well, January 1 is really the start of it. But yeah, like, like every earnings was just, they were just getting crushed and so to see you know, lemonade up 34% and you know, even Sedg like coming out of major, major downtrends like if we're at the top and like this is truly the top of tech, we, I, I don't think we'd be seeing these sort of candles right now and you would not see, you know, names like T holding up. But this one's going to go on my needs more sideways list. It's not, it's not like it. I would buy it tomorrow if there was news in the morning and it was gapping over this line. If it was gapping over 4.5 and there was some stellar news, I would buy it. I would be interested in buying it. But just from a technical breakout perspective, I'm not super interested in it because yesterday close was not an inside day. It's just kind of, kind of sloppy. You know I like, I like tight inside candles pressing a key breakout level. I don't really have a super clean range so. But it'll go on my knees. More sideways list, who knows? Not too much on your scan, Matt? Yeah, I'm predicting it's going to be the same but we're also just kind of monitoring not necessarily for actionable setups. Like right now so far there's not a single actionable name. We'll take a closer look at the names on the needs more sideways list. What I'm going to do first is we're going to load the needs more sideways list. So we're essentially manually filtering the scan results and then we'll see if there's anything that can be on our trigger list, on the focus list. So we do have QBTS reporting in the morning. IONQ is holding up. I covered the 20,000 shares or whatever I had short in in my main account. I'm just not going to deal with it. So it'll be interesting to see what QBTS does tomorrow. But we do have LAES holding up really well. The MACD is still red. Yesterday is a relatively tight candle and we still have this really nice base setting up. You know if QBTS like has some, I don't know, crazy sort of earnings or news release or something, who knows. I mean LAES is kind of in its own realm and the way that you tell that is it doesn't look like any of the other quantum names the charts. So like IonQ looks like QBTS, right? Qubit does not look the same as the others, it looks worse, but it's still kind of a loose. Kind of. It has a loose resemblance, but then rgti. So really the core three are rgti, qbts, ioinq. Qbts and RGTI virtually have the same chart. Ionq is basically the same charge is a little stretched out, but then you have like lae switch. You can still tell it has resemblance, but it's, it's different. It's kind of like in its own land. Which means that whoever is shaping it's just. It's not happenstance that qbts and RGTI have identical shapes. I mean, like, just imagine that like there's no two snowflakes that have identical patterns. Right? So like for RGTI and qbts, why would their charts and our GTI trades the most volume, I think out of any stock with a, you know, ADR over 8 in the market. Like, why would its chart identically resemble qbts? Well, it's because it's the same people trading, right? So yeah, this one looks really good. It does look really good. And it, it's kind of cool that it doesn't match the others exactly, which means that it may have some other sort of edge, you know, within its story, within its business story. And I actually, I think it does. I think it's more like a quantum security company or something. I don't know. That's what, what Chungus was telling me. But yeah, it looks good. And we have this pretty clean level here where it's the gap high and it's yesterday's high and let's see where else it kind of touches. And it basically goes through the meat and potatoes of this entire range. So it look, it looks pretty good. I'm curious to see what QBTS does tomorrow. So I'm going to put LES on our news websites list. This SNDK is another juggernaut. I'm going to go back to my, my little tally sheet. I'm adding another one. So that's three. Like it made new highs today right before earnings. For me personally, there is a setup here. It's a breach and fail short setup on earnings. Very similar to how I traded Palantir where I shorted it to 17. So this would be something that I personally would put on my needs more sideways list. And it's essentially this. And I can go over the PLTR trade as well. I kind, I botched the covers. I should have held it longer. So this would be like earnings failure breach B. And. But none of these are like bread and, but like, this isn't like a bread and butter sort of setup. It works well though. It works well. Like if it were to gap up to like 250 or something ridiculous, it could kind of blow off its top and, and be a good short like pltr. Oh, here's another one. I'm gonna add another tally. So it's another stock making highs. Qs is notable. I'm gonna add a tally. Like, everybody thought this thing was dead. Today was a big you candle. This one's going on. Needs more sideways list because. Because, whoops, I just typed needs more sideways. All right, here's the stock. Needs more sideways. Doesn't look bad. First flag. All right, Qs. Another thing that I like to do often is literally sit here and just imagine, like, just imagine if there was a tight candle like this tomorrow or something. I don't know. So like, you can imagine how like quickly, like what, what would this chart end up? Which setup in your playbook would. Is this chart building towards. And it's like a bull flag. You know, it kind of did that like left side peak unr perked up. It gave a good setup here. That was a good buy. What was that three days ago? But now I think just with more sideways, it's just going to be a nice bull flag potentially. And that's what we want to see set up. Right. And so like, you're not going to buy it tomorrow. The level that you need to breach is our highs is this 19. So there's really like, in my mind, there's no point to buy it before 19 at all. So we want it to set up and get tight and ideally press 19 so in a few days it could get there. But we're going to set an alert at 19 anyways because for all we know, there could be some sort of earning or there could be some sort of news that comes out and causes it to gap into these relevant highs. And you know, we can, we can play it from there. I know a lot of people don't like buying Gap ups. Me, I love them. I personally love them. I think it's just kind of how, how you play them. And why is the stock gapping? They're news gappers, right? And so like, you just have to be kind of cognizant of the news and the volume and that is it gapping out of a really big base. Because if you look at, if you look at SLDP LMND light, you could have bought the 5 minute orbs on every single one of them. And been absolutely breading today. Me, I snoozed. I didn't pay attention. To be honest. I've been totally occupied with, with the NQ short and, and the soybean long. So I've been a little exhausted and there haven't been many setups. But I. The one, of course, the one, you know, morning earning session I miss, we just have fireworks. So QS is on the needs more sideways list. I'm going to set another alert just kind of over this peak just to keep my, you know, just to make sure I'm paying attention. I only trade with one screen, guys, so. And that's on purpose. I don't need all these other screen. I don't need to see what's going on in the market on 15 different screens. Doesn't matter to me. The length and quality of my watch list tells me the health of the market overall. So I don't really need to be knowing what it's doing. Like, if, if my needs more sideways list is red, well, the cues inspire red. So, like, I don't need to look at them to, to see that, see that we're red. I do look at them though, all the time because I'm actively trading, you know, nq. But yeah, like, you don't, you don't really need to see. See everything, you know, during the day executing, I'm only focused on the names that are on my focus list. I mean, that's my primary focus. And so I don't need to be looking at the daily because I've already marked my trigger lines. I've already marked them. I've already done the work the night before like we're doing now. And I know that if price pushes through this line, I'm just buying it. I'm buying it. So I don't need to see the daily anymore. And I have daily moving averages plotted on my intraday charts. So I, I'm purposely set up that way to keep me solely focused on my focus list. Okay, let's keep going. Fubo. I would say that this is a notable candle. Even though it kind of failed, it's still, it's still causing shorts pain. So if we're at the top, I mean, it is there. There was a pretty big correction in the indexes, right? I mean, names are down. You know, some spec names are down 30, 40% just in the last week or so. But if bears or, you know, if the short side of the equation is not in pain, then I would say, you know, we're. We're Going lower. But if they are in pain, that's a good sign that we're potentially going higher. And this would just be another one. So I have six names now from this list that I know. CIFR is another one. So it's seven. This flnc looks pretty good. So I love its recent chart history. This is actually very similar to MU where it had that big linear move up. It's kind of long downtrend, perks up, puts on a tight day and then expansion candle over the 200. And so if you would have bought this day before you close below the 10 as a 66% move and then up to high is 175% it sells off in a linear way. This is a very steep sell off. Sold off 36% which, you know, that's not bad. That's a third. Puts in a real tight day and it pushes higher. So there is a bit of a bear divergence. So I would like to see it kind of, I would like to see it honestly come down and then continue to build out this flag. But it looks, it looks good overall. It's got a lot of momentum. It's in the right theme. It doesn't have a super clear defined range yet for me. So if I'm buying through the high volume close, well, we're already above it. If I'm buying above the, the high volume closed day, well, it found support on it today. So where's like my range? Is it highs? Well that's not really like a clearly defined range yet for me at least like this down here. This was a clearly defined range. You know, price is continually respecting a line. I don't really have it here. So for me I would set an alert up here just in case there's some news event, you know, some sort of EP or something that I can evaluate on the fly. But it needs to go on the needs more sideways list. If it had a few more tight days and if it rejected highs a couple times, okay, well then now all of a sudden we can kind of kind of start buying or building that range. I mean this was a big candle today before earnings. It's super choppy. I'll skip on it unless it wants to. I mean maybe down the line it'll, it'll change its character up. So IonQ is technically a pwnr. So it undercut this left side peak on earnings. It's popping back up through it. You may get a couple a day bounce or something into these overhead moving averages. But this is not a setup that I'M super excited about long. Some reason it doesn't want to load oklo. Did the whole list just change? I think the whole list just changed. I have it sorted by Mark Mark percent change. So things are like moving around right now. I probably should not have done that but the problem if I sort now by symbol we have to like start all over weekly downtrend break flnc yeah I guess you have like this kind of thingy going on. I what I see here is a weekly unr like that and then yeah I guess you kind of pop through this line. Yeah, something like that. See I don't like the, the large. I don't like the larger time frame version of the chart. I don't like the weekly very much. It's just looked like forever. I mean it has changed its character recently and it's definitely worth watching. A lot of momentum. I mean like if you're ever confused or like you know should we, should we pay attention to this? Did it make a big linear move up? Did it pull back in a linear way? Did it find support on some relevant level ascending moving average neckline, whatever? Did it put in some tight candles and reclaim and surf? Like that's what we really look for because that's the definition of momentum. That's how you define momentum. This one's a little thin but it looks good. Like this would be one I potentially put on my needs more sideways list. I'm personally not going to do that. But it doesn't even look like it's gone up. Like it's kind of just like ascended like it has these days. Like right here is you know four days but it went 130% and then here's two days 40% and here's one day 40% one three days. So this thing's like good for what is that like 50 pops in like one day. It's a good 30 EMA magic chart. Yeah, See ampx See I didn't take it because I just cannot get over this middle finger candle. I just hate it when the chart gets out of alignment. It just bothers me and I, I don't really ever see great moves come from sloppy ass charts. Like unless it's like a surprise EP or something. But usually the best moves come from pretty charts, not shitty sloppy charts. You can tell an invest an investor. Like I don't, I'm gonna use it this term stupid but I just made it always like an investor grade chart where like people they don't, they just, they, they don't care about like the way that the chart actually looks like Sedg a couple years from now will, will be higher but it's going to be this choppy journey that traders just were not able to sit in. Now down here like when it emerged out of this like big base and it put on this first flag like that was beautiful because we had our clue right here in 10 days it went 60% and it was not a headache at all. Like look how clean that 60% was. Every one of us would love to have that move. And so once it made that kind of first flag we're like hell yeah. And then look, look at the second leg. 100 so clean, crispy clean. Then you get this other really nice long kind of linear downtrend. But this is like my first clue that and on really high volume that you know there could be tumultuous seas ahead. But still it gave us a nice 3 day pop 50. But ever since this chart has fallen apart like this chart looks like ass and it's got this nasty bear divergence and it's just been causing traders like the worst headaches, the worst. You know how many people bought it here this day it's gapping at all time highs and then you just got wrecked and then you know so many people like bought it here because this is a really nice tight candle. But you cannot forget this big you candle. I mean that just happened. That's real. And look what happens. Right? Yeah, it's frustrating. And look we have earnings. What is that tomorrow? Yeah, there's earnings tomorrow. So for all we know could just throw an insane, you know, earnings candle and we have a brand new chart essentially. So if it did throw a stick been held up it would just go on our needs more sideways list. Okay so qbts, I am going to put you on my needs more sideways list but for not the same reason. I'm not going to trade this thing. I just want to remember that it exists for tomorrow. So I'm going to put it there. I know that there's earnings tomorrow in the morning and then I'm also going to put just a line right here. This line doesn't mean anything. It's just an alert and it should ding through it and that'll tell me that Quantum has strength and then I'm going to start looking at laes. Did I put an alert there? Cool. Another rule guys. Every single name on your needs more sideways list must have an alert. Must. It's a rule. It must have a purpose. If it does not have a Purpose. It does not belong on your needs more sideways list. We need to keep our needs more sideways list pristine. Signals only. Okie dokie. Where was I? This is light, damn it. Where is it? See, like, I don't think we talked about neg, but I know we talked about sndk. Like, I wouldn't have just skipped over this. I think this, the whole list just got rearranged. All right, guys, I'm gonna do this. I just, I just filtered by by name. AAOI reports tomorrow. This is just another little bit of insight that I have. Light we know is on our needs more sideways list. It made a really great move. And also, if we were paying attention to earnings this afternoon, Core is into all time highs. These companies, all three companies kind of do the same thing. So aaoi it is choppy. It's been very choppy. So is Quantum. When it was building its range, it's okay if the stock is choppy when it's in its range. If it's not building a range, it has no excuse like to be choppy. Right. It should be trending. So like here, for example, it's not chopping. It just went up 170 in 27 days. So we know that it has the ability to do that within the last year. That's why that's. This move right here is what we're holding on to. This is what we're looking for. But it seems like nothing's gonna break this thing out until earnings. So somebody's waiting for earnings. Us included, me included. So it's. We're definitely gonna have to breathe. And I'm gonna put it on my needs more sideways list. Actually, I'm not gonna do. I'm not even gonna add it. It's too far away. I'll get the ding. I'll see it in the afternoon. Be fine. Okay. Avat, you're dead. A lab. We gapped up on earnings, right? Nope. Just stuck in this. So here's the setup that I see that's really close to 200. So I'm just going to round up to 200. So it's a really nice, clean level. This is a pwnr setup. It's not quite close enough, But it is gapping on earnings slightly. So I'm just gonna set an alert. It looks good overall and it kind of is. It's just really emerged out of this bottom base. Like, I know it made a really big move. The move isn't the cleanest. It was hard to get situated. And this base down here was super Choppy. It pissed a lot of people off, me included. And then it did actually finally give you like there was a couple of setups. Nothing, nothing that great. Like even if you were to buy it here on this day, well, the very next day it basically retraced all the way down, which is just a pain in the ass. This day was the day to buy. And then you had, you know, a 30 move in 10 days. Like there's so many other charts out there giving just, you know, way better returns that are way more linear. So if we think about the cleanliness of the chart and kind of give it a score, like there's no way that it can be a five star chart in my mind unless it has a history, a recent history of making really big clean linear moves. So like if it doesn't have that in its recent history already, it's at best four star. And really we just want to trade, you know, the five stars. This is another one that you could put a tally down. It's just a big candle, kind of a big reversal candle. Very. Talk about the mpx American. These guys, these guys got crushed on earnings down 13%. So I like APLD holding up well. It needs a lot more sideways but it reclaimed this gap level. See if it's doing something afters. Yeah, it's trying to resist going higher through this, the 20, 21 high. But it's holding up really well and it's starting to build a flag. The low of this day. Let's see what the low is low. 3283. Just some randomized number. 32.83. Or the. Close. Sorry, close. All right, there we go. Much better. 3399. So that's 34. Much better. Okay, 34. So this is like a PW and R sort of variant where it's undercut the gap level so PW and R can undercut left side peak or the high volume closed gap level. Like if you have a, like it could unr the low of the ignition candle which is kind of this. So it's set up, it looks decent. You have this downtrend sort of setting up. The MACD is just so steep. I would like to see it pop up and, and build a base. Pop up, build a flag, something like that. This would be one that I would track and I wouldn't trade. So if it were to trigger through 34 I probably wouldn't take it because more than likely it's going to just hit this line, come down chop. If it does blow through it. It'll stall somewhere up here and build a flag. So I'll put this one on my needs more sideways list for now because when you thought it was going to break down, it didn't. Which is really important, especially in the face of the market pressures over the last week. You know, stocks that attempted to break down but didn't are the ones that we want to pay most attention to. Like here's another one. This one had a bad candle, but now it has two tight candles and it's holding up regardless of like a moving average or a left side peak. It's just kind of holding this kind of low here. It's got earnings. ASTS has just been a juggernaut. These things can only, only go so long. Like this first leg was huge. Pulls back this whole almost year long range just gave longs and shorts. Yes. You know, a lot of frustrations. I mean overall it's made some really, really good moves though the cleanest move seemed to be from like these bottom bases. Let's see. Like this flag was good, but I, I don't really know what you do here. It's got earnings. So we'll see it then. Bit F. Looks great. I think this one will. This one looks really, really good. I mean it's out of all of the shitco crypto miners turned company data centers. It's so linear, comparatively speaking. Like it's beautiful. Like, let's just go through them. Wolf is a choppy mess. Wolf reminds me of like the Reddit trend or like it's just, it's not, it's. It's like an investment. Like if you would have bought it this day, like that's like that's the only day, maybe this day, but you would have bought this. And then you're just sitting in this grindy, you know, you're sitting in it for 30 days to be up 20. That's just insane. Like none of us would stay in that here. You may have still been in it, but then you just are immediately in a range again. Like that just sucks. Like this is not, not a great, great trading stock. And you know my mind I see downtrend on the MACD now can't make a higher high on the macd. So you have your high here, then you have your MACD high and then you made a higher high on the price chart but a lower high on the Mac. That's, that's a bear divergence where momentum is starting to fade. And also look how tight the chart is. And then now it's just getting loose again. Just loose. And we have earnings. This is. I don't know what's gonna happen. I'm not particularly interested in shorting these names. I don't really have like, strong enough thesis. I know that what they provide is highly in demand. So, like, I don't want to get in in the way of a, you know, a speeding train, but. Yeah. Oh, yeah. Anyway, so Wolf and then let's. So that one's not very clean. Iron is. Is pretty clean. You know, it trended from. If you were to buy over this high. So if you're about like this area, it didn't close below the 10 for 186%. That's. That's a pretty damn good move. There's definitely some, you know, like the, the channel isn't the tightest, but if you're not closing below the 10 for that many days, it's pretty, pretty freaking sweet. And you know, the way that it looks right now going in, earning like, it's. It looks, it looks dangerous. It looks dangerous for sure. But this one is definitely way more linear than. Than Wolf. It kind of reminds me of Aeva. Like, this first ramp was so clean. That's why the first flags, guys. Like the first flag out of the base. You know, if you see this first leg, so clean and then you. You track like that first flag, that first consolidation setup, like, like that's. That's where you want to buy. I mean, that's the best time to buy. So what else was there? There was also hive. Pretty damn linear. Like, I honestly, I like this move better than Iron and Wolf because it has these like marching green candles where there is no look back and you have a super clean, well defined downtrend. Like, I bet you this is like 50 with no headache. 100 in 10 days, no headache. Like, these are awesome moves. Really, really, really great moves. Downtrend break, first flag, and it just ripped. Yeah, it looks. This is awesome. So then we go back to bit F and bid F, in my opinion, is the cleanest one litter. Every single open is higher than the close before. That's what we want. Like, we don't want to wake up and you buy a stock like you bought an awesome breakout candle. And then like in the morning, it's gapping down halfway down into that candle. Like, that sucks. So when you see, like, its ability to like, treat you well, that's amazing. That's what we want. And so you had this other really, like, nice tight consolidation here and you had a very similar clean eight days, 100% move. Like we all should have been in this. I missed it but we all should have been in plenty of volume. But now though it's showing a very linear sell off and I would love to see it perk up, build a little flag and then we're off to the races. I don't think that they have any major, major deals that they've executed on or that they've you know, gotten like Lois signed on or something. But I'm just gonna set a kind of a random alert over this peak. The, the MACD is also just so clean. Like the MACD is matching the price chart identically. Like all. I love it when all three charts match. The cleaner the better. There's not like, like that sounds like voodoo. It probably is but just for some reason the cleaner the price chart typically the cleaner the volume profile typically the cleaner the macd and if they all kind of match, you know, I think it's. I don't know. I haven't thought enough about it to like oh yeah, you know this is what it definitely means. But one thing I can say anecdotally is that the, the biggest, most linear pain free moves come from charts where all three price, volume profile and MACD notch. But yeah, it looked really good. This one's definitely going up and needs more sideways list. If this thing sets up, I do not want to miss it. It's beautiful. Like this and look at that. It just held that left side so, so wonderfully. Yeah, it's, it's awesome. It looks so good. Bttr it, it has a lot of momentum but it's just like chaotic moves like this just sucks. It reminds me of. It's like the, the smr of data centers. Another thing to note and I didn't do this but you can also have a tally sheet for all the names that shit the bed. So if you have like if you're taking, if you're keeping score of names that, that resisted going lower, that's great right? Like I'm up to eight now. But then also you keep a list of names that just shit the bed and there's no bounce. Like they just are broken still. That's also another good way to kind of, kind of judge and you can, you can automate all this too. Like you could use Pradeep's breadth monitor or whatever. I, I don't need any of that. I just use, use my watch list and scan. This thing's holding up. But. CRDO looks, looks good. It's made an insane move. It's building a bear divergence, which isn't too wonderful, but it is a unr for me. It's probably more of like a three day bounce short setup than anything. I'm, I'm personally not convinced that we're ready to go higher in the immediate. If the stock gods just came into my dreams tonight and said, you have two months of Sideways, I would believe them. I wouldn't be like, quit playing with me. I would be like, all right, yeah, that makes sense. So, you know, to see a ton of stocks just all of a sudden, you know, make highs off of these pretty crappy red candles. I'd be, I'd be pretty shocked. I would be less surprised if we saw like three day bounce shorts, which last week we saw a lot of those. Especially since I don't have actionable setups yet on my watch list. You know, the biggest like ray of light, like the biggest like, holy, we're still in a bull market. Came this morning with, with sldp, Element Light, even Sedg, even though I'm not going to trade it. That candle, Rivian, like seeing like Rivian throw a stick out of the depths like that. But you know, if, if we're, if we're at the top of 20, 22 right now, Rivian's not doing that. I'm sorry, it's just not. And if there's any continuation at all, like, we're like, if all those can, if all these candles just splat tomorrow, just reject like hurts today. Even though Hertz literally, like, I don't know what the going on over there. We'll look at that chart here in a sec. But you know, yesterday, huge 40 day. Today it retraced the entire thing. Just God awful, terrible, terrible behavior. But then I think it literally bounced and like closed near highs. Like seeing that, I don't know, it just, it doesn't really tell me that that market that we're over, we could use weeks of Sideways. But so like right here, csiq. And this is another like I, it's a solar name. I put another tally down. I got, got nine gaps down, immediately springs back up in the face of earnings and then gaps up 20%. Like, come on, that is insane. That's awesome. Dave's just kind of still building this big range. DD I didn't even see Dupont today. I mean that's, that's awesome. Huge volume. I mean, look at those, look at the candles. It's all ahead of earnings too. I mean, I'm sure they had news But I don't know that's strength. But this would be an example of one where it's been strong. It's had a lot of momentum but it didn't bounce. Like the last four days, all four of them have been lower. While where was it this one csiq. It had two bad days, but I guess maybe halfway. Well, not even two bad days. It had one bad day and then it gaps down and then it just right back to highs like, like that's, that's relative strength, Dave. I would say it has relative strength too. It just reported and it didn't break down. It's just building the range. Like this is what I call expanding the range. So it's just build in this range and this range is going to be probably end up being huge. I probably should add it to my needs and more sideways list. I just know it needs probably a lot more sideways like weeks but we can add it there. This is one that we should be tracking because it has shown a lot of momentum in the past. Big clean move and it's, it's showing a lot of relative strength. So in a few days to a week or so it could be set up for, for a long and it would be out of a big base. So like if it's on your needs more sideways list, how long does it take? Like what's the shortest amount of time that it could be actionable? Well, I guess technically Dave could be actionable tomorrow if it has news and gaps over this, the, the earnings rejection high. But if it's just building a technical pattern, it probably needs a week, maybe two, something like that. So you know, I think maybe if you're within 30 days, 21 to 30 days like striking distance, it can probably go on your needs more sideways list if it's something that's like, you know. And how do you know how many days it needs? Just kind of comes from experience. Like if you can imagine the pattern being built out properly. How many bars to the right do you need for that? Because one of these ignition candles like SLDP or let's look at lemonade, it can be actionable tomorrow through the high volume close. So if it sells off tonight, so is it below it. So look it's going to sell off some. So tomorrow it could come down to 75ish, who knows. And then if it has a strong momentum, move back through that line. Well that's actionable. That's a setup of mine. It actually should, I should start tracking those and putting them in. I should, I'm gonna make another channel. All right, note. So that's high volume, close. It is an actionable setup for me. So it could trigger tomorrow or it could take. It could go sideways for two weeks and build a flag. But 30 days out, I would imagine that it would have. It would have had plenty of opportunities to either set up like a shoryuken, like if it gapped down, put in a tight day on the 5, or you know, builds out like a high, tight flag, something like that. It's going to be doing that within the next 14 days. You know, maybe four weeks. Like a four week flag would be. You're kind of getting to the point in my mind, at least how I define it, where you're kind of not a flag anymore. I don't know what you are. You're just kind of like building like a, like a bowl sort of style, like a big bull flag. You're not like a high tide flag anymore. But in all reasonableness, it could trigger tomorrow legitimately, or it could trigger in a couple weeks. But I wouldn't think that it's. It will. It's not going to take six months to set up. If this thing isn't going higher in six months, well, it's probably way, way, way lower. All right, let's keep moving through these. I forgot where we were. Where were we chat? I think we were at, Dave. Thank you, sir. DD yeah, DD is. It's strong. I'm not going to add it to the list though, because can anybody tell me why I'm not going to add it to my needs more sideways. Listen, it's too slow, all right? This thing has a lot of momentum, but I'm not going to add it to my needs more sideways list because. This trend is super, super choppy and I. I just don't want to be a part of it. Yep, you got it. They reported today. Let's look at the 24 hour chart. Okay, they're holding up. This looks good. This looks good. So where's our clean line up? Nice. We have a really good line too. Okay, so this one's probably actionable for tomorrow. Tomorrow. So I'm going to use the hive. I'm going to check and see where the high volume closes. So 1545. I'm going to move it up to 1550. Nah, I'm going to go back to 1545. Okay, 1545. What's the high here? Very cool. So that's like that. All right, so if we're gapping over this line tomorrow, I will Maybe look for a washout long or something into it as support. It all depends what happens tomorrow. But it's definitely a name that I would use my short term time frame skills to, to try to get situated in. Super in theme. Had earnings did not D over 16 would be sweet and then over 16 this high would be even better. I would rank it like, I'd give it like you know, a four to four and a half like sort of setup and if there was no earnings then and it just looked like this, say we had no earnings, say earnings were like a month ago or something, I would say it needs more sideways and it very well may actually need more sideways but it's actionable because it had earnings it didn't sell off. It's an irrelevant theme. I have a clean line going through a high volume close level which coincides with yesterday's high. So we're not going to be buying unless price is above yesterday's high, which then also means it'll be above that high volume close level. Right. So effectively, you know, moving through the most relevant resistance. Yesterday's high is always like the most relevant resistance. Because if you're buying within yesterday's high, you are a range is, it's like inception. It's like a range is within a range. Within a range, within a range. Right. And so you want to make sure that you're trying to buy outside of all of them. And that's why, you know, in all my back tests that I've done and I've done so many now all like nearly all of my strategies have failed in the back test where I do not buy above yesterday's high. Now caveat, I haven't done many back tests yet with buying like first touch sort of setups which I want to. But in pretty much all other events where I get to the execution criteria of the trading algorithm, if I set the toggle the requirement to not required for, you know, not required to buy over previous high day, it's not very profitable. So anyways, the fact that this one had earnings today and didn't sell off and we have a pretty clean level, it's actionable for me. So I'm going to put it on my needs more sideways list and I'm going to put it on the focus list and you know, I could wake up tomorrow and I could look, look at this thing and it gapped down 10% and it's, you know, it's no longer of interest but it's within striking distance. If it's within striking Distance. We want it on our trigger trigger list. It. Hive is a pwnr setup. It's too far away from the line, but it will go on the needs. Mercy was lost. So already the fact that I have this many names that have the ability to be actionable in the next couple of weeks, high momentum names where the charts are still intact and they've withstood recent market pressures amongst names in the scan that haven't is a good sign. Like, and I know that was a mouthful, but overall that's a good sign. Like this right here. I don't know what the going on here, but this is this one. When I see stocks like this, I just think crazy things can happen. I mean, just the volatility and the volume, it's just ridiculous. Is it. Is there a setup now? Not really, no. But a few days, it could build a flag out and then break this line or break whatever this level is.750 or this high volume kind of gap level. Yeah. Herz is one that's going to go on the needs more sideways list. And we're going to pay attention to this one. It's kind of like a big first weekly flag downtrend pops up kind of building this flag. It's not very tight. Just crazy volume. I mean, there's interest here, a lot of interest to the volume. Wasn't that crazy? What did it do yesterday? 120, 130 million. I mean, it did well over half a billion bucks yesterday in volume. That's nothing to sneeze at. It's just where do you buy it? Ideally I'd want a couple of days sideways to kind of build out a daily flag. But I mean, look at this. Hourly. Like, They'll always give you a nice little daily pivot. They'll always give you a nice little tight daily candle. Like, even if it were to just like explode out and like run to eight tomorrow, it's to stall and it'll build a flag eventually. It's not one that I want to buy right here, but yeah, we just want like a tight. A tight flag. I mean, all in all, this is still very wide and loose, but it excites me because of the range. Any stocks that can do like, do this sort of range 100, 100% in a week, two weeks I'm interested in. And then we start looking at what is their, you know, how relevant are they fitting in with like, you know, the market story, you know, what's the volume, like, what's the range like? This range sucks overall could set up in the next 30 days. So I'm gonna put it on an east sideways list. It already is there but it's not like super duper excited. Oh yeah. Hut's one. Hut is not faring as well as it's comrades. Doesn't look that good but it's. It's held up. Held up post earnings. Wonder what the story is here. I can tell you what though. If, if iron or if iron were to falter tomorrow, this one's gonna the. And this is a short setup that has been documented pretty well in the, in the discord. It's one that I, I don't know if Kwala Maggie actually like used this but there was something that always stuck with me that he said and it was when, when like these small and mid cap micro caps, small caps lose the 20 day SMA there there's a really high probability that they're dead. And so the. Lose the, lose the 20 make the money became a pretty good, pretty good short setup. It doesn't happen often. I mean obviously most of the time stocks go up so you don't, you don't get it very often. The stock needs to consolidate a bit which is what we're seeing. Earnings are out of the way and so the fact that it didn't just like, like blow up, you know, post earnings, I don't know, tells me that, that the reaction's a little bit neutral. But if iron were to shit the bed or you know, one of the other ones that are like wolf, you know, probably number two in line were to shit the bed, this one's gonna die. But it's shorting any of these is, is, is kind of a headache because there's so many potential catalysts that could just fuck you on the, on the short side. Like iron. Like anybody who shorted iron the other day with that big gap up, they just got wrecked. It's almost like shorting a biotech right now where there's so many potential unknown, kind of unknown catalysts. But anywho, this thing's got a lot of momentum. It's a bio. I'm not going to pay attention to it. It so Ido data, really big move up. I don't like it when stocks make really big moves up from setupless situations. Like this isn't really a setup that are in any of our playbooks. It didn't even have a bull divergence on the macd. Like it's just like a random. I don't even know. There might have been news that day or something. But what was really important was look how linear this move up was. I mean, it was awesome. Ever since it's had pretty sloppy, crappy move down, but it's still, in my opinion, you know, like, it's still sort of in play. It's holding this left side level. It's about a 50 retrace, retracement, maybe a little bit less. And you got earnings. We'll catch it in earnings. But I'm going to just set an alert at this unr level just to keep an eye on it. It makes big moves, and this is actually like the nicest move it's ever made in its history. Yeah, definitely. Like here you had one great big candle, and then here. This was awesome. But it just came from a, like, kind of a setupless place. So Joby had earnings. It's holding up. It just needs a lot more sideways. I don't know. I'll activate this alert at 17, but I don't know. It's not even to go on my knees. More sideways list. Because even if it were to perk up and get tight against this line, it still has the rest of this range to deal with. It's just way too, way too wide and loose. It's 30%. You know, wide range when it's APTR is 7%. Like, it's just not. I mean, actually down here, that's closer to 40. 45%. Yeah, 40%. It's just too wide. It's getting narrower. Just needs a lot of sideways. And the fact that it couldn't, like, really push post earnings, it's just going to keep building that range more than likely. So, yeah, we're getting a rotation definitely where we're seeing some new. Some new leaders emerge. Lumen is one to watch. Big U turn starting to build out a flag. It chopped me out here. I'm so pissed about that because I was long from the Palantir partnership. But Lumen will go on the needs more sideways list. It's got a big catalyst. It. This U turn after earnings is just crazy. It shows me that it's totally willing and able to just shorts, which I love. It's holding this left side peak. It looks good. It just needs to build a flag or something. Yeah, yeah, I'm definitely. Yeah. I'm starting to see what Matt saw. Where. Damn, that's just murder. That's like mean reversion almost. Holy. Look at that. Look at that volume. How much did that retrace? It's a. I just don't really like setups like this. This late, kind of in this bull leg. I mean, it might work. I don't know. I'm not. It's. It is really close. Let's take a closer. So, like, for it to be. For it to match my playbook for a parabolic bounce, it needs to be down 75 from highs or, I'm sorry, more than 70 from highs. So it didn't quite make it there, but it did put in. Is that highest volume ever? I mean, it's pretty close. Second highest volume ever. And it's basically pressing this left side. I don't know. It's like a scalp. This would be like a good 30 EMA magic setup where it's like a day or something. I don't know. I'm not. I'm not, like, excited about it. But you do have a clean level, and price is pushing it. It does. It should bounce. You just had crazy high volume. It could probably do something I'm just not super excited about. Holy. Doesn't even look real. There's definitely more charts that look like than ones that look good. Today was a day to buy any gg. I actually bought it tiny bit today in one of the family accounts. It's just super thin. Yeah. Like, at this exact moment, looking at this exact scan, there's definitely more charts that look like than don't, Which isn't a good sign. Open is just hanging out for earnings. Now. Like, if we had a couple more days of earnings candles like we had today, then all of a sudden we don't really need to even, like, think that much about the old leaders because we have a whole. Like, this is what we want to see in a market that, you know, names are starting to get stale, per se. You want to see, like, brand new kind of surprises coming out. Soybeans. Oh, wait, Plug. Plug looks good. It's setting up for. For a unr. It's coming out of this, like, insane base or this insane downtrend. Plug is, I think, the only Stock that's made three, like, over and on three different occasions, a thousand percent move. And I think two of those occasions are, like 3,000% moves. Like, it's definitely perking up. This volume's crazy. You know, they. You know all these companies that, like, just have, like, been hanging on for dear life. Like, they're the ones who potentially could see, like, the most boost from AI because they, like, can't afford a bunch of. So, like, you know, if they're able to utilize AI properly, who knows? They may. They may be Able to have some breakthroughs. But Plug has already shown its ability recently to break a big downtrend, put a first flag on and then it made a really big clean move. 100 in 10 days and then another 100 in 5 days. Like say less. That's what we want. So now it's undercut this, this relevant high like three bucks roughly got earnings. This one's going to go on my needs more sideways list because it has the ability to make just absolutely ridiculous moves, linear moves. It trades big volume. Like Plugs trade in real big volume. So this one's interesting. Super interesting. Out of all like kind of the shittier companies on this list. I do look forward to this one quite a bit. Just because if you study there aren't many charts that have like these repeated just insane moves. They're just insane. And there's so many trades within here. Like this little leg, like every leg is a hundred percent like it. It's just crazy. And that was the, that was the second time. Here's the first time. I mean this thing is just, it just goes absolutely ape. So now you put AI and in the toolbox of, of these co operators, who knows where, where this thing can go. I do know that this move is extremely linear and that's what we want. Big linear, high liquidity moves where we can get, where we can manage our risk. Man, this is a great candle. I actually bought it down here, but I think I sold this day. Dainty bought it around the same time and I think he sold maybe somewhere over here. Here. Did I put it on my list? Plug? Yeah. I saw somebody ask me about a chart up here. Let's say. Never mind. Can't find it. Pump. Pump. Damn. Pumping. Okay, okay. Pump. So let's just like go through the motions here. Big downtrend. Yes. Broken. Yes. Highest volume ever. Yes. Explosive linear move. Yes. 100 in 10 days. It's a little thin but you know, if that meets your account's liquidity, you're fine. So big move up pullback. It's building this flag, kind of building out this little range. I mean this one looks pretty good. I don't know what they do, but it looks pretty good. Just for this like demo sake, I'm gonna put it on my knees more sideways list. But yeah, this was like the greatest candle of this company's history right here. Now it still needs to like it has a long history of being a complete piece of. So it's still gotta like prove itself a little bit and you can pick up on Those nuances. Intraday. Like, if the intraday action is relatively clean, if there aren't a ton of, like, fake outs and like, just. Just headache, headache sort of intraday action. Like, this is really smooth all the way. It looks great. Those could be signs of. Of character change. So, like, you know, where. Where do you buy this thing? You buy it right above this high volume close, which is exactly right. Right. Hit it. It's thin. So, you know, you just got to make sure that it matches your. Your liquidity profile. But it's funny, that high volume close corresponds directly with this left side beat, so you have that confluence of those levels. It looks good. I mean, it's. It'd be like a. Maybe like a. I don't know. It's up a lot, and the moving averages haven't caught up very well yet, but it's one that you could take a stab at, potentially. I'd probably want to look at the company a little bit. I don't know if it would go on my focus list. Like, I want, like, stocks that go on my focus list. There's no doubt. Like, I don't want, like, you know, I don't want to, like, feel like, oh, you know, this or that. Like. Like, you don't have to think about it. There's literally no doubt. Okay, guys. Our cat really kind of shit the bed. E. Yeah. When you see names like this that were leading, falling apart, like, it's going back to sub 3 for sure. Unless it just springs back to life or something. I definitely see more. More destruction than I do. This would be Italian. I like seeing new names, though, have ignition candles. Like, that is really where kind of the hope lies. I own so far. So fly. There's SoFX again, though. It's so. This chart, it's just so wide. I've been sitting at it as an investment for almost six months now. I don't know, it might break out and give you, like, a real clean, linear move. You can try it. Like, this was the best move that it had here, so it has the ability to do that. But this is just chaos. It's like Wolf of the Shitco miners turn Shitco data centers. Even though it's more linear, it's still super wide. But then you go to, like, a bit F and bid F is just tight. Super tight. You go to Aeva. Look at this first leg. Like, that doesn't even. It doesn't even look real. It's so tight. Like, you know, if you just traded these charts and if you had the ability to be patient enough. You would, you would outperform anybody you've ever met in the stock market. Like, anybody you've ever met who trades. If you only traded stocks that make a big linear move up, a linear pullback, they undercut, they get tight, they build a crisp, like a super crispy clean base or a flag or a whatever, whatever sort of entry tactic you like, set up, whatever, as long as it's clean. Like, if you only traded those, you would, you would outperform every, everyone. Now it's, it's. The trick is only trading those. That's the hard part. Like me, I would never have bought and like bought oust. I saw a bunch of people buying it, like here and here. It's, it's just, this base is just so sloppy. It was just so sloppy. I saw people buying it even after this. And then it did it to them again. Like, if somebody's going to like steal from you, somebody stole from you. Say you met say, say, say somebody in college, like on the same floor from you, like you left your dorm unlocked or whatever and like this guy stole something from you. So like a DVD or something, right? And like you can never prove it. You. But you knew it was him, he was a thief. Other people kind of talked about him. Okay, fast forward 20 years, you happen to be working the same job as I'm like going to remember that. And more than likely those qualities are still about, still about that person. So, like, if you have a stock that you over once, There's a very high probability that it'll you over again. So like, let's just look at it like there was no setup here. I guess you could have bought it, but yeah, it just got over. But here there was like actually kind of like a little, nice little flaggy thing. And then you could have bought it through like this left side peak. And look at that, you got a big expansion candle. Beautiful. All right, but you're neglecting this. You're failing to acknowledge the history of the chart. And it's a trader fucker. You don't want to trade stocks that have a history of traders. Like that one, you know, girl that you like, she just got a bad history out there. Like, I don't know if you're gonna try to like really try to wipe her. Like, that's not a very good analogy. But you know, like, if the dog bites her hand once, there's a high probability that like, you're not gonna put your face next to the dog. What you're gonna get bit again. Like, come on. Like, for me, it would have seemed seriously had to change its character back up. Because to go from this beautiful ramp to a high, tight flag. And then it pushes a few days, like, okay, cool. And then here. Okay, that's not even that bad. But then as soon as it started doing this, crash. And then it pops back up. Crash, pops back up. Crash, pop, crash, pop, crash. Like, people were still buying it here. I'm like, bro, bro, what is wrong with you? Like, like, what is wrong with you? And then, no surprise, trade stocks, like, right here. But it has a tight candle. Do you not see this giant. Like, you know what this reminds me of? You guys have seen those videos on social media where they, like, put like a. Like a. A rod in the bicycle seat. Like, they like, put a b. Like a rod in the bicycle seat. And they like, set it up to like. Like in an area where, like, for sure somebody's gonna steal it. Like, that's what this chart is. Like, you sit on the seat and the rod just Gaddafis you. You don't want to get Gaddafi by, like, you have the luxury of seeing this history. Like, it's not like it's like, it doesn't exist. It's here, but it's uptrending. I'm gonna buy it through highs. Like, bro, did you not see what it just did to all these poor innocent traders? Those are the things that we need to pay attention to. It's no longer clean. This is no longer clean. Don't look at it. It's shorter. Plug still clean. This is our first sign. But it made a really big move. Two very big linear moves. But this is a clean, clean sell off. It could keep selling or it could perk back up and kind of build out a flag. And then we. And then we pay attention again. Poet, they're nothing. Clean. It started to get clean. It started to, like, make, you know, an interesting move, but then it just went straight back to choppy Hell. Relapse. Trade. The ones that the leg, like, right here. This leg right here on qbts Quantum has just been so insane. This leg was very clean. Builds a tight flag. Another. Like, you can make 50 in a week on these things. It's just done it so many times too, which is crazy. That one's not. Not nearly the cleanest. Like the fact that QS did this in the past. They can do it again. It wasn't that long ago. It's a little. Kind of crappy, choppy in here. And it has traders around a Bit, but it's just building a range. Like, let's let it. Like, I won't. I would take it off my. My needs more sideways list if it like breached 20, went like 21, 22 and then crashed back in and just had like one of those big middle finger, you know, bicycle seat prank charts. Like, if it has a bicycle seat prank chart, don't. Just don't even pay attention to it. Like, this one's still good. Like, this one's still good. It's, you know, it's had some like, turmoil, but it's fine. Big move up. Linear pullback. A very tight channel. Very tight, very clean linear. Nice little tight day. Find support on the 20. Boom. Gaps up with some thunder. Now it's making higher lows. Little wedgie thingy. Just go sideways here. Press 22 a couple times and then you have like a five star high tight weekly flag. Okie dokies. Next. Oh my God. We got to get through this. All right. No, no, no, no, no. I hate this stock. I tried to trade it so many times, just me up. Because it's just these choppy trends. I do not like. Like stocks that have a history of choppy trends. Like Galaxy choppy. As I traded, it wasn't that good of a trade. This is much nicer. This is nice. It's got earnings in a couple of days. Pims, piece of. We already got you. These are sideways Herz. This is a. This is a clearly a trader, but I would not trade it within this range. It needs to pop out of it and build a flag. And if it can build a really nice linear flag, we're. We're there. Okay. So I mean, just off like the top of my head right now, if I were to. On a scale of 1 to 5, if 1 is the market is completely risk off and 5 is the market is completely risk on, let's get all our money in. I would say that we're at probably a very solid three right in the middle, maybe even slightly below. And the reason I say that is I. I'll probably end up with more than one actionable name. But they're not coming out of like the most, like my favorite types of setups where we get that super clean leg up and a super clean, tight short consolidation. Like those continuation setups, they're not coming out of that. They're new names setting up that are kind of changing their character right in front of us. Like SLDP, Lemonade Light, etc. Which is good though. We need some fresh meat. God, that looks bad. That thing's. They're done. Did they report today? So it looks. And this is one that I'm trying to learn. I know Matt, you were talking about or asked me about it earlier. So like imagine it put in like a tight day or something and then it popped right back through this line. And then it did like, you know, one of those crazy like u turn thingies. I want to figure out how to catch them. We don't have enough chart history in our discord database yet. But I think it's going to involve like a bottom pin, little bottom pin, like where it gaps down one more time and then it puts in a tight higher, low and then back through this left side peak. Like I'm not saying that's going to happen here. This thing could just go to. But we've seen them happen recently and I'm not ready to totally pull the trigger on setups like this. But again, like what I was saying earlier, kind of using that imagination and thinking what could it become? Well, it's definitely a classic kind of unr potential. It could just pour over and die. I mean oust has been in, you know, has been relevant for quite some time. And this is a really big base. Right. But it's like how do we catch. And this is just me always, you know, adding things to the playbook and just, you know, thinking through like you. You was so unfortunate. You know why? It breaks this downtrend. It puts this first flag in and it makes this big ass linear move. Like just what we. Like just what you want to see. Builds this beautiful flag. Just what we want to see. And then everybody buys it here. And it just wait, it opened. Yeah. And then it just like it just is a kill candle. But then look, one little tight day, little hammer candle and then right back up through the line. Right. So unr so how. Obviously we need more examples in our playbook to feel comfortable with taking these trades. But to get it on your radar, you would essentially need a history of big move up. It's capable of making linear moves and then it has this kill candle and you're like wait a second. Would the chart gods really forsaken such a beautiful chart? Are they just with us and lots of times they're just with you. And the craziest thing. I think this was the highest volume ever candle too. Why did that happen? I don't remember. I don't know. Something. I should have a chart now. But it put in a really tight green day and then it just rocketed Just rocketed. Literally went 64%. Let me see if there's a. Let me look at the U turns really quick. What was the other one? APLD was the other one. So I'm pretty confident that it did basically the same thing. It wasn't nearly as much of, like a hard sell off, and it didn't have nearly as nice as a base, but kind of did the same thing. Okay, anyways, back to where we were. Where are we? I think we're almost done with this list. Liquidity. What do these guys do? Baya, This is a setup, but it wouldn't. I don't think it'd be much of a swing. Candle is insane. So, like, if our bread and butter setup, at least mine is like the big linear move up, like here, plug, and then you could buy this little flag. I don't see much of that, but with all the ignition candles today, we see the making of it, like, pump last week. All right, we just need to plow through this and then I can answer questions. I still got to do my scans. So, like, the reason I'm doing this sort of impromptu chart talk is because of a question. That Abomination had in. In the pit. And he. He was just trying to wrap his head around, like, how. How do you use the length and quality of your watch list to kind of, you know, judge risk on, risk off? So me, I. I do it. This looks good. I do it sort of naturally. But I think it. I think it really comes down to how many actionable charts do you have tomorrow and how much continuation are you seeing in the marketplace? So today you don't really see a lot of continuation, but you see some strong reversal candles and new ignition candles, which is great. So, like, if tomorrow we saw SLDP lemonade light continue higher like, like with a lot of thrust, and then we saw new names emerge, I would start feeling pretty. Pretty good about things. If we could survive a three day bounce in the, in the queues, I would feel much better. But at the end of the day, there aren't any setups that I just absolutely need. But I see a lot of promise. Like, I. That's where I kind of gave the market like a neutral three. It could go. It could get worse for sure. It could start getting worse tomorrow, or it could start getting better tomorrow. For it to be a four, I would just need to see more strength clean moves. For it to be a five, there needs to be a lot of recent strength, a lot of recent clean moves, and many actionable high momentum setups. Like if we just saw names just crushing earnings. Like again another like that's why I was kind of freaking out about this morning because I've never, I can't remember the last time I've seen so many giant sticks coming from a pre market earnings session. It's just great, you know, it gives you hope. Sym looks good. I bought it this day and I sold. I don't even know this one or this one. Probably the worst one. Not yesterday. I know I sold half of it on day three and I exited the rest yesterday. But it looks good. I mean you have a really clean level of 80. It looks good. I mean it's, it's super clean. Am I in love with it? No. You know personally I kind of think that Tesla will end up doing something like it'll do like a unr or it'll just go sideways enough to you know let, let the rest of the market, you know, kind of catch up or get it together. It does have like this big middle finger kind of you candle. It's starting to build away from that history but it's had some. I mean it's in a range obviously it's building a range. Is it really just going to go into all time highs without like I don't know, is it even at all time high sales? I doubt it. Like, I don't know, I feel like it needs something in the set like the, like it's building a nice range. Like it's tight. Don't get me wrong, It's just wildly extended from. I feel like it needs to unr. To be honest, I personally own it for much lower but from you know, just trying to add something here. Look, look, you can't not take it through this line. Like you can't not take it but it's just without seeing many other charts continuing higher with like clean power. Especially coming off of you know, the run that we're coming off of. I mean great. God bless it. It's holding up. That's awesome. I'm willing, I mean I, I would feel like it would be more, more inclined to just kind of reject. I mean you still have to take it. You have to because it's a numbers game and you understand that as being, you know a consistent momentum swing trader that you're playing a numbers game. But yeah, I could see it rejected. Obviously this name has to go on your needs more sideways. So the need somewhere sideways list is accumulating quite a bit of merchandise. There's just a lot of this man that's crazy. There's just a lot of that going on. Like where these charts that were building nice big ranges are just completely going to like complete Christmas tree. Like the nicest charts are just kind of going to mush. So yeah, that's why I'm like I would be, you know, on our scale of 1 to 5, like I'm probably just below 3. This thing looks really good. What is this? Oh the fuck is this thing? Tell me about this one. Is this. What is this? Is this a shitco miner turned data center? What is this? Tell me about this. I know you guys know ETF data center. Okay, okay. Yeah, yeah. Oh duh. This looks amazing. This looks better than Fuck. This one looks really good. It's a little thin. That's hilarious that there's an ETF for these things. I mean this is like honestly, you know, one of the best looking charts. Look how clean it is too. All right, that's the whole list. You guys have any other names you want me to look at? Oh, 25 is iron. Yeah. N U A I why wasn't it on the scan? This is a short. This looks like a perfect short Perfect breakdown short. Tried to break out just an utter failure Retraced everything closed at the lows of the day tested the 10 tested the 10 sitting on the 10 is it gapping down? MACD cross down. This just like looks like a perfect short. Perfect breakdown short. I kind of like it. Thank you. See, I don't really see any like Sal, you know what the chart theme is right now? Like the chart theme that actually interests me are giant ignition candles, lemonade SLDP etc. Okay, next one. No can. Okay. Yeah, no case too slow for most. I think it's like 480R. I would today was this really weird price action. Just rope like like literally robo trading straight across. I don't like that. I mean there's enough of that computerized trading happening intraday. Like it's all like fake liquidity. I don't know. And it just kind of. It's just weird. Just behaved really strange. I mean that goes away when enough organic volume comes in. But like seeing this on five minute is crazy. Like one minute and a lot of these charts like even on open like if you're gonna open and look at the one minute you'll see the barcoding like this is more organic. Like when you have like this like intraday I don't know. It's weird. Okay. GCI chime did chime report. I think they report they may report Tomorrow. No, they reported. Huh? They held up too. Oh, yeah, totally. Yeah. This is an awesome divergence pivot. Yeah. So you could just buy over. Over yesterday's high if you want. Probably Price is already over, right? Yeah, basically. Yeah, it's already over. So you could buy tomorrow or you could wait for that first flag. It's. It's probably safer to wait for the first flag, but I mean, you could give it a shot tomorrow. You'll just have more headache because it'll probably chop around and build out that first flag. But it looks good. It definitely looks good. I mean, this is definitely a divergence pivot. And you would, you would watch divergence pivots for that first flag. Sometimes it just goes straight up, but you know, like, I want to see that it breaks out and then builds that first flag and then we can kind of go from there. But this looks good. Like right now we want to trade stocks that are going up into the right. So it looks like it's about to go up. So let's just let it do that first and let it build out a flag. Like, I don't think it's like right now is not the time to really be longing anything. Like really close. Like, arguably you could, I mean, you could have bought those ignition candles to today. Like, that would have been like out of those earnings reports. I think. I think that's okay. And like, marginally so. But now that we've seen them, I think, you know, if we were to see another volley of them tomorrow morning, tomorrow afternoon, Friday morning, Monday, Tuesday, like, I think that we can start striking just even the ignition candles, like the five minute orb in those. In those names. What happened to my sou? I think they've gotten wrecked. No, it's holding up. No, it's sort of looks like Aehr P. Whatever. Looks okay. Yeah, it looks all right. I mean, it doesn't really make very clean moves though. Like you get like this pop up kind of two days and crap, then big gap up and crap, gap down, crap. Like, I'm not. Not super interesting, super interested in this. What was the other one you asked about? PT G? This is just like a bio, right? Like some random bio. I think Rani is just kind of like a random bio too. Kind of like a random bio pump. Yeah. Like, guys, I don't really trade like, like random bio pumps. Like, like that's how you get. That's how you get cooked. Like, unless you understand that realm. Like, I'm not. Like, there's so much inherent risk with these things. Like, you have to be totally up on, you know, when are there, like, reporting dates or their, you know, one of their. The hell do they call them? Not checkpoints, but whatever. Anyways, I don't even care because I. I don't want to trade them. Like, we all saw what happened with Q, U, R, E. Like. Like that. No, thank you. Trading's hard enough. SEI looks pretty good again, though. It's just kind of has this bear divergence. It's held up post earnings. I wouldn't say that. Like, this is a big you candle. It looks good. I mean, this is pretty linear. It's pretty nice move up. It's coming from a setupless place, kind of coming from these, like the bottom. But yeah, I mean, it has a history of like, you know, that's a nice move there. This is a really great move. But here, like, it. It failed. This continuation flag, like, it built like this nice flag. It broke out, failed. Like, you have to take this setup, though. If you're watching it, you're taking this, like, every time and just, you know, part of doing business and happens the way you size, right? Oh, it just needs a lot. It just needs more sideways. What's. What's slnh? I mean, that's a huge move. I mean, it's pretty tight. Pressing this left side peak. 3 1/2 bucks. Is it bitcoin related or Solana related? Saluna. I mean, it looks good. Honestly, it doesn't look terrible by any stretch. I mean, this is a PW&R. It says tech data center. I mean. Okay, learn about this one a little bit. It looks. It looks pretty good to me. I mean, you just always ask yourself, like, big move up, pullback, undercut, like, it's tight. When it did make the big move, I mean, it's, you know, it was. It's 200 in five days. I mean, that's great. And then it gave this second big move another 100 a couple of days. So it moves. See, the intraday, though, is just. You can't trade that. That's untradable. That's. I knew there's gonna be something wrong with this thing. I mean, this intraday action is basically intro. I know. It's consolidating here. Let's see how it was. Let's see how it was on those initial. Initial days. I mean, this is brutal, brutal action. I don't. I can't stand the crazy brutal. Like, yeah, 60. But then it literally in. In an hour, two hours, it gave it all back. That was a Clean day. This is a clean day. I don't know. Go back and study the days where like this day. Like if this day was clean, this day was clean. If these all had clean runs in those days then that would make me feel better about it. You just don't want to have to get into like a situation where it goes up 100% like intraday and then it retraces the whole thing and it's up another. It's just a pain in the ass. But it, it honestly looks good. I would look into it a little bit more. I'd look into the company a little bit. Yeah, it doesn't look, I think lbrt, don't they? Did they report today or is it tomorrow? Wait. Oh, never mind. Lbrt. Yeah, it looks okay. I don't know why BTU didn't come up. BTU looks amazing to me. Like I really, really like btu. BTU is. It's because I'm doing this random scan for the, for the stream. But this one looks great. It's perfect line at 30 super linear move like so clean. 100% really clean downtrend. Perfect wick off of 50. Perfect wick. Like I'm, I'm curious to see what the wick was intraday. It almost feels like it would be like one of those types of wicks where it's like a single five minute candle. Wicked. Was that it? Yep. Look at that. That was it. And it was previous low day. So it respects our technical levels which is important. Like I like seeing stocks respect the levels that I'm paying attention to. It looks, it looks really good. Just, I mean it's, it's not the thickest thing but. So this is an example scan. I'm gonna just ditch it and I'm gonna use, I'm gonna go through my monk scans and pull names. But I mean all in all though based off this let's, let's look and see what actual like actual actionable names we have tomorrow. I have lemonade. Lemonade will need to be. Now I need to mark my line. Oops edit. So I'm going to say it needs to be a unr of high volume close. Like for me in my, my playbook. Like this is my routine. I have to do this. I have to mark every single trade premeditated because I'm not going to be looking at the daily all that much at open tomorrow. So I need to see like this is what I will be looking at. So hopefully price comes down, it sells off and then it pops, pops Back up because that's kind of the, that's the setup I'd be looking for. Lite is another one where you could take that same setup. And the reason why this works is because. Well, I don't know why it actually works. It's a lot of momentum, a lot of interest, but there's plenty. There's a ton of examples. And this may be like kind of a new, new setup for you. But in the past, like if you just go back and study all the major earnings candles or the big ignition candles, this happens very often where you'll have a big gap up. Let me see, like maybe Palantir had one. You have a big gap up and then price like right here. Okay, this is perfect. So this is the big gap up on earnings. And then in the after hours session it sells off some and then price opens below yesterday's close and then you buy through yesterday's close. So this is essentially the setup that I'm looking for. It's super tight risk because the candle will expand through that high volume close and then through previous high day, which is really where you should buy it. And then you can use the high volume close as like your stop or a percent stop or whatever stop at the five minute formation below. But yeah, that's, that's kind of the setup that I would be looking for here with Lemonade. SLDP is already doing that. So it's kind of perfect already where the close was here, 850 and it's already down to 8. And so it's holding this left side peak. And that's also the. Yeah, it's holding that left side peak. So this one's set up kind of perfectly for it. It's already doing it. So I would set an alert here and like these whoops. Whoops. These aren't like just like random like setups. These are. What am I doing? My brain's not working. These are setups that are in my playbook that, that work. And do they work all the time? I don't know. No, they don't. But that's fine because our risk is super low and they don't have to work all the time because if, if it's going to actually work, it's going to go up, you know, know the thing's going to go to 20 or something crazy like that. So this would be unr of high volume close. The. It's not above it. Why is it, why is it dinging? Is it like the ask above it or something? Yeah, that's Annoying. Yeah. So like from this watch list, these would be the names that I'm most interested in. And all three of them would be earnings continuation plays. And I would, I should also look at, I mean I personally, you know, if I was actually really going through my motions, I would be looking at the earnings from this evening. And see if there's any, you know, big sticks that we might be able to take. Like, like if we were to have taken Lemonade today. Lemonade was gapping out of the range over the five. You just bought it over the five minute orb so you would have bought it here. Same thing with Lite. You just bought it through here and then sldp, same idea. So you just take five minute orbs for these. This one was the cleanest. That's crazy. It was just like straight up 40% running an hour. Huh. I don't know what this is. Alto ingredients just kind of like a random, random thing. I don't know what it is, but it's up a lot. Oh man, this volume's so low. Core. So we saw at just don't like core's chart history. It's just kind of choppy. It's not terrible but. Chime is like an EPDP sort of setup. Be interesting to see how, how it does tomorrow. But you know, all in all I, I'd give the market like a 2.2.9 out of 5 right now. We're still in an uptrend. We saw some great ignition candles. Hopefully we see some more we have open tomorrow, which I'm excited about. I wonder how the like big tech looks like Metaluck so meta kind of maybe found a bottom. Amazon I own it looks great. Retest the left side peak. It's actually that's like a setup tomorrow. Google looks great. Nvidia I think reports next week. It's doing pre, pre reporting. Let's see. MDST. No, I don't think so because it only traded 27 million today. It doesn't look bad though. I just want to see very clean big moves up. Like that's what we need. I need like this. I, I like it. I, I can see what could be kind of alluring. You know, it's a big move up. It's pretty linear to nice pullback. But for me there is no setup in my playbook that that is this. I, I just don't, I couldn't match it to anything now if it like went lower and let the 50 catch up and get tight. Then all of a sudden it's like, you know, A unr. But there's no, there's nothing in my playbook that I can. That I can say for sure that that's what this is. Bldp. Yeah. This one looks. This one looks pretty damn good. I mean had this big, really tight range. This is a big clean move. 50%. Did we already talk about this one? Feel like we did? Yeah. Power company. I mean this looks great. It's building this flag. It's got earnings and there's nothing you can do until earnings. Like you hope it throws a stick and then it goes underneath more sideways and then you have like that high volume next day or you're waiting for a flag or something. Pl looks good too. It looks good. Very, very clean move. Clean sell off. 14 is a really nice number. Yeah. If it perks up, it kind of curls a bit. Yeah, it looks good. I don't really have a set. Like I don't really like. I would like it to perk up and then build a flag or something. I don't, I personally don't have something in my playbook that would make it actionable for me tomorrow. Like that wgmi like this one's actionable for me. Like I would. I wish it was pressing this line better but I mean you would still be kind of buying within a range over yesterday's high. But it looks good. I just don't know how you buy it until iron reports and they're reporting in after hours. So. Yeah, yeah, it looks good. It's just. What's the range. Like? 6375 is kind of that left side peak and that's that highest volume high. Like really it's over this high. 65. Because it's weak. It just tried to break out and it utterly failed. And that's a, that's a really ugly, ugly candle after a crazy run. 1500% run. Closing at the lows of the day. Just kind of clinging for like dear life. Like right here. It just tried a gun. It just got stuffed and no bounce since. Just crap. And it's. It's just kind of random. The MACD just rolled down. Crossed down volumes fading. Now if it broke down and then popped back up would be much, much more interested. I mean I'm not interested in it period. Like, but it would be more interesting. And the moves that it's made, I mean it's made some awesome moves but they're just like one day moves which is totally fine. Like these one day moves are, are awesome. It reminds me a lot of Negg any GG gave so many opportunities. Like, here was the DP. 100%. 170% buy through this line. 200%. This thing is just so crazy. 60%. Oh, you got this little tight candle. No big deal. 50. 60%. Little flag 48. Oh, little what. What are they called? Judah. You call them the 2Dvl right there. Boom. A little Judah setup. 80%. Like, yeah. 2D LV. Yeah. Like, it gave so many setups. Nuai is like that. But it's. I don't know, it just looks sketch to me right now. Well, anyways, I hope this was helpful in using your watch list and your needs were sideways list as a barometer on market health. You know, we know that the market is sold off relatively hard after a big run, so it's nice to see some bounces. That's great. But there's also a lot of stocks that just have not recovered. So you see some that have recovered, but I would say the majority of stocks are kind of broken and kind of, kind of messed up. But that's fine. I mean, it's. The majority of stocks are really never running in our favor. Like, we are focusing on a very narrow set of stocks from our scans. But, you know, once we kind of filter down to a narrow set and make that December sideways list, how many actionable traffic cards do we actually have? And I mean, I could probably make a case for some of these other ones, and who knows? Like, this one's definitely actionable, but it's not going to be actionable in regular session. Tomorrow it would be after hours or, or Friday morning. But things can change really fast. Like, you know, like I said in the last chart talk, we need to let earnings get out of the way and we need to see some new, some new momentum emerge. And again, like I've said this 20 times, you know, in this talk that it was a breath, it was, it was awesome to see these ignition candles, you know, this morning. So hopefully, hopefully the market keeps it up and, and we have some new merchandise. But, you know, we're more than likely, in my opinion, like a week or so away. And the reason I say this is because this is pretty nasty. And I think that we'll probably get like a bounce. We might even get, you know, a bounce back up to like 2600 on the NQ. Let's actually just look at the keys. Like, I would not be surprised if we get like that, you know, three days sort of bounce action before coming back down and testing, testing like this, you know, 610 level kind of going sideways a bit. I mean, guys, this is just an insane run. You know, as much as we want to fill our portfolio up with new positions, the best opportunities arise after, you know, decent corrections. So I would not say that this is very decent yet. I would love to see like, a UNR of, like, 600 even that would be sick. But be patient. Yep, Neo looks good. Alrighty. Well, I'm gonna sign off now. Have a good one, guys. Hopefully this helps. Talk to you later.