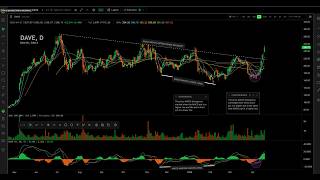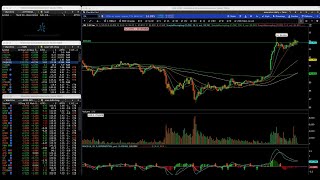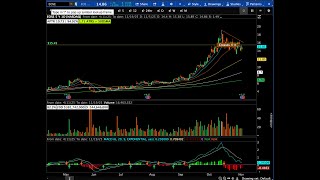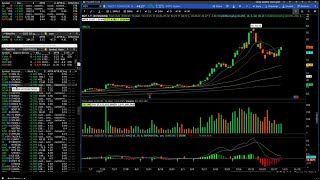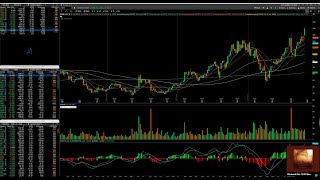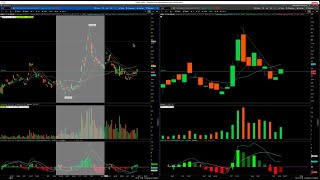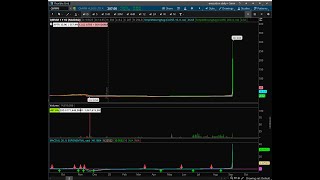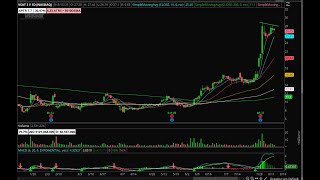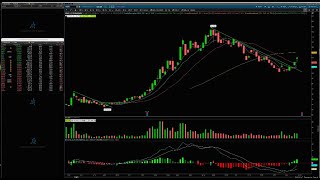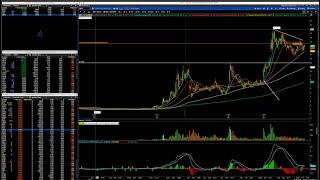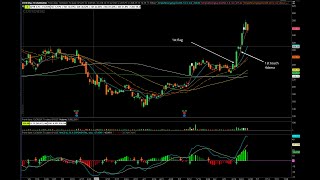
Alec Riffle walks through live charts to teach first flag and first touch breakout setups after downtrends break. He covers position management with alerts and trimming on white magic candles, plus using moving averages and MACD to define downtrends.
Chapters
Weird anomalies happen. My screen may cut out something I don't know. All right, sweet. Thanks, Kenny. Kenny boy. Appreciate it. Kenneth boy. I don't want to assume that you're okay with the nickname Kenny. If you are, let me know. Kenneth boy is cool too. All right, let's go. Okay, so we have a scan ADR3 plus dollar volume. 200 million plus. That's probably fine. Okay, let's do this. Okay. Tesla. Tesla. Tesla. Tesla. Tesla. Needs more sideways. It's trying to break a behemoth of a. Of a downtrend palantir. Shit the bed. Last five minute candle recession actually was a pretty good short setup. It failed to make all time highs. Well, it did make all time highs, but it failed to meaningfully advance through 145 two days in a row. And what do you know? Got hit with a little bit of end a month Friday rebalancing. That was a hell of a candle. I care. Oh, lord. Well, no surprise. Look at this thing. I don't even want to look at it. Cam dizzle. Straight up. You know, most of the market's straight up, to be honest. Ah, here's a good example of what I've been talking about. First flag, first touch. First flag. First touch. Some may say that this is the first flag. Me, I like to look at downtrend break. This is the first flag. So you could have bought this one first fly breakout. Then you could have bought this first touch. Coinciding with left side peak. Coinciding with a very round number. Whole number 350. 350 sounds good. 350 sounds great. I actually own a little bit of coin. I bought it one time right here and then I sold it right here and then I bought a little bit back right here. And then somebody made a comment about not buying anything headed into a Friday. And I was like, you're probably right. But a setup is a setup. So we're in there. With the way bitcoin's behaving and the absolute momentum that coin is demonstrating, I would say it continues. It's the first touch, baby. We're in there. So I don't want to get into that right now. All right, let's just keep ripping through. Corey. MSTR is shaping up splendidly. Broke like this big downtrend, double bottom off the 200. It bottomed before bitcoin. Some may say it's lagging. Bitcoin. I don't really think so. They don't have to move in lockstep so long as the Overall trajectory is. Is in line. So, okay, we have a big move up. Big linear move up too. Very low volatility. Very orderly move. Much more orderly than. Than this move here. Much more orderly. Like this. Holding through. Yes. You know, it's linear, but it's a wide. It's a thick, thick kind of channel. I like my channels real tight. Real, real petite. I don't like thick channels. This one. Look how, look how petite this channel is. So much more narrow, which is great. Low volatility. Low volatility and big, fast range from the bottom. If you're. If you pick this, this donker candle off the two hundo, which in hindsight now I've studied the setup I will be trying to do next time You're. Let's say you bought it back through the 200 price moved away from your average immediately. And, you know, at the peak, you're up 71 and 22 bars on a stock that trades $4 million a day on average. That's. That's insane. With zero volatility. So for the people that are on Twitter or whatever, X talking about, like, how MSTR has lost its volatility, its range, you're like, it's just dumb. Like, it's so simple. Just measure the chart. Just measure the chart. In fact, it's even better. It's in a range, too. Historically, volatility within ranges is choppy. Right. Until you get to the end of the range and then you get what's called a. A contraction pattern where things get really, really tight. But, like, this is. This is a blessing, this little leg right here, which hopefully is a, A preview of what's to come. Anyways, a couple of days here. Look how tight the moving averages are. Look at that. Doesn't. You don't even need. You don't need the 50, you don't need the 20, you don't need the 5, you don't need the 10, you don't need the 30. You know why? Because they're all the same thing right now. They're literally all the same number. They're all the same number, so. Looks great to me. Looks great. I'm gonna get rid of all of this crap. But my line is 400. Is it actionable tomorrow? I don't know. Doubt it. Who knows? I heard that there was some bill getting voted on regarding capital gains and bitcoin. I could definitely hit. I. I don't know where the stage is. I'm not going to speculate too much. I mean, the price will tell us what to do. But we're looking. We're looking mad these. Mad these. It's a little too far away. I'd like to see it tighten up or even break out and kind of give us a first flag pattern. But I'm going to set an alert because that's what responsible traders do when we set alerts. Okay, we're gonna set this alert. I got two of them, I got three of them. Then I'm going to put it on. Oh, you know what we're going to do? We're going to create a new one and we're going to call it need for sideways. Oh, needs more sideways. Call it slow. All right, Sweet. All right. Great setup. Song Oracle. Oracle's a little too slow for me and it's kind of extended. So it is. It's not a first touch. It is kind of a first flag, but I'm not really interested. Mu same story. But man, look at this first flag out of mu. Beautiful hood I own from. From the basement. I own a hood from about here. We're chilling pims, kind of doing what I predicted. I didn't really want to like scoop the. Scoop the dump, but maybe it'll set back up. It needs a lot of time. Chart's broken. App crowd. We're in crowd. This has just been a choppy piece of. It's not a trading stock. It's a buy and hold investing stock. I don't even know. I think I bought it here. I'm up like 5% int sizzle. American semi is going to have their day. Well, prove it. Let's see break out of this. This downtrend. Give us a flag. Look how tight all the moving averages are. Something's cooking. Something's cooking. Volume's huge. Do something smci. So SMCI is interesting. Such a. Yeah, I don't know. To get back. That whole move is just. Just outrageous. And they make, I think, glorified server racks. I don't know what they make, but this move was awesome. This base was awesome. This whole setup was awesome. Like, give me that. This people are talking about it, but it's not awesome. It's just sloppy, choppy crap backside. You know, like Baba had sloppy, choppy crap backside. But at least, you know, at least the moves were linear. So like it did a big move up, pulled back, broke out of this downtrend and gave us a tight flag. Made like a really linear, shallow, yet steep channel. That's like perfect, right? But you look at smci, I guess right here, you had kind of a Flag, but I don't know, it's just. It's just like breakout. Show me a really big leg and then give me a nice flag and maybe I'll be interested in. I'm not going to try to pick the bottom on that thing. Marvel is arguably the worst. Semi. Semi. St. Everyone calls you Kenny. Perfect. It's a good strong name. Carvana, you're just. I just don't even want to look at you. Okay, so Reddit. I actually own a little bit of Reddit already. But it is kind. It's setting up like first flag. So it broke out of the space. Maybe it comes back down. I think I have an average like 126 or something in there. Just need some sideways, but I'll put you on. I need some sideways just to pay closer attention to you. I own so far. Well, this thing is gone. All right. Why is my zoom not holding? We're gonna go one year. All right, cool. This thing was choppy. Super choppy. I just decided to buy a smaller position, smaller size because I got chopped out of it like three times. So I just gave it more room. Like you see the band? Like the channel is thick here. So it's real thick. And then now the channel is very narrow. We want narrow channels. Those are the best. Thick ones are choppy. Aneth looks good. So it's like downtrend break. It's building its first flag. Go sideways a little bit above the 200. Get tight. We're in there for APTR. You trade a billion a day. I'm cool. You do have pretty choppy chart history. Let me look at a little bit more. No, I just can't. It's so ugly. And this stretch wasn't bad. I mean, it's had its moments, I suppose. I don't know. It's hit or miss. It moves pretty big though. I mean that's like a point a day. I don't know. You know, I'll put it on my knees and reciters loop just, just because semis have. Have been really linear. Like Avgo has been a choppy, choppy mess. But not recently. It has just been a narrow channel straight up. Look at flagged rate at highs. Boing. Gone. I should have bought it. Should have bought this gap up. Should have bought this gap up. That was like. Yeah. Then there was this little flag here. But this, this gap up was nice. Where were we were at a. I mean, it's a. It's. It's a bit of a laggard, but I could have Bought it two days ago. Want to put on my vst? You are gone. Okay, this is interesting. Quantum is not going away. It's not, it's not going away. As much as they want it to go away. It's not going away. It is not going away. Big move up now. You want to talk about a thick channel. This is like just garbage. I mean kudos if you held that. But it's just brutal down here. It was much more narrow, much more manageable. Much more manageable. Will it act that way moving forward? I don't know. It's hard to tell. Like, like I expect it to be a wider band, you know, when it's cons, you know when it's within, within a range. But we want like momentum and speed. When it sold off here from, was that February to March. I mean that was a very narrow band down. Makes sense. It's up so much, but we popped right back up. Huge volume on this day. Now it's just kind of flagging. Like over 50 over these highs would be cool. It definitely needs a lot more sideways. Like unless there was news and it pushes it through, it's not going to go on my needs more sideways list. Obviously it does. But for me to be actionable, it either needs some catalyst, some big push through this line or I need to like build a flag over that line. I think the same goes for all of the. All quantum and new makes good moves. I mean pretty good. So here's one, let's say yeah, 100%. Is that 37. So a little bit less than a point a day. Tight right now, kind of flagging, kind of a big sloppy, loose range. Real big range, gap down, big earnings candle up, no movement down, really tight pops up. Now it's putting in this, this little flag. It's not the prettiest thing. I'm gonna put it on my knees more sideways right now just, just because who knows what else we'll find. But you know, based on, based on the indexes making all time highs, I, I can see us totally just locking out and ripping for I don't know how many sessions straight. But I could just see it because it's happened before. And if you look at all the leaders, what did all the leaders do from hood to Palantir to Netflix. They pushed, you know, they sold off tariff news, they bounced back first. They pushed all time highs, they put flags in and now they're ripping. Right. And if there are any, if there any preview of the future of the rest of the markets, well, the Rest of the market's kind of doing the same thing right now, is it not? Look at that. Okay. Same thing. Like the rest of the market is lagging leaders, which is the way that it always goes. The leaders lead first. They're the ones who advance off the bottom first. They're the ones who make new highs first. They lead the chart progression. Right? So big move up flag right through all time highs. You know what's doing that right now? And this same thing, it's a tad. It's a bit of a laggard to be this late in the progression. I mean, all the leaders have really done all this. But you know, I haven't really seen many fail. I haven't seen any of this pattern fail yet. So I will take nbis absolutely. This is actually. This is totally actionable for me. I know I skipped ahead a bit, but. Yeah. And wait, is this all time highs, max month? It's all time highs for me here. But I was talking to somebody earlier and they said on Trader View there was a lot more chart history. Somebody confirm. Is there some like old history with NBIS that I don't know about? Anyways, it looks great. Oh, sweet. It was coming up. Whoa. That's crazy. I was only a couple away. All right, RKL Dizzle. This thing's a choppy piece of. Piece of too. So yeah, I chopped myself out of it. I had a great average. I don't even know what I was thinking. But anywho, it gave like this real like sloppy flag. I bought it in here. I don't know what I was thinking. I just kind of sold it. An idiot. But this first touch was good, this touch. So you could have bought it off the five. Definitely could have bought the five there. But it's gone. She gone. Tem's finally starting to shape up. I'm falling victim to it. It's gonna. It's getting me. This thing is a soul snatcher. I just seen it wreck people. I promise that I wouldn't get. Wouldn't get wrecked. I haven't gotten wrecked. But I'll put it to you this way. It definitely owes me money. Definitely owes me money. It's not a healthy way of thinking about it, but that's just the way my petty ass thinks about it. It owes me money. It's starting to give you confluence where a line has many touch points. So he rejected whatever this line is. 69 figure on Friday. We rejected it Thursday. We rejected it Wednesday. We rejected it Tuesday. We rejected it Monday. Last Friday we Bounced up like this. Like bounce, bounce, bounce, bounce, bounce, reject, bounce. Rejection, rejection, rejection, reject, reject, reject. Okay, so 69 is like a lot of confluence, right? Toxic relationship for sure. It's Nancy Pelosi. I'm telling you, dude, she's bad vibes through and through. But, but, but, but what are we starting to form, like really consistent higher lows. Low, higher low, higher low, higher low, higher low, higher low, higher low. Look at all that. Okay, what else are we starting to get here? Well, if you look at this big move up, look at all the moving averages as we kind of tumble come right back down, they just get completely out of whack. From your lowest moving average to your highest moving average, you have a delta of 40%. Okay? Not including the 200 because the 200 just started. This is the two in the 200th day. Now we have a delta of less than 20%. So the range is twice as tight as it was. Perfect. Well, look at it here. Look how tight it was here. This is a range of 8%. Okay. Suggesting that it still needs sideways. It's still a sloppy mess. I mean, I would be totally fine taking it like above all time highs. First flag above all time highs. Because if you were to buy it here, breaking out of this line, you got to fight with this one, you got to fight with this, you got to fight with that, you got to fight with this, this, and you got to fight with Nancy Pelosi. Somewhere along the way. I. Let's just wait for Nancy to get out of the way, which is probably all time highs. I'm not going to be tempted. This is a big base it's building. If it's going to meaningfully go higher, I want it to go a lot higher than 90. Like, I don't even know what this company does, right? Like, do they have the possibility of going to 200, right? Like, does the stock have a possibility of doubling? If it does not have the possibility of doubling, I'm not totally interested in it right now. Given the size of my accounts, like there's just no point. Right? Like I'm not like a super fun trying to, trying to eke out a measly gain. Like, can this thing double? And based on the volatility within this range, I would say so. But I don't know. I have no idea. It's sloppy. Get your together. Come back to me when you're ready. NBIs, let's go. Okay, now, NBIs. Okay. NBIs is, is a new, new stock. It looks like there's not A lot of history here. Unless somebody answered my question earlier. Trader View has old data. There's more history. Okay, somebody post a screenshot. You know what? I'll do it myself. I'll do it myself. Oh, I hope I just didn't blow something up. My screen freeze. That would suck. Okay. All right, what is it? So you got. So this is the week weekly chart. Okay, there's the beginning. Wow. Back in 2012. What changed? What's the story? Well, the chart's not relevant in my world anyway, so I don't give a. But I am kind of curious. I am very curious, actually, because, I mean, look at this sell off. What the. It's like a. It's like a sell off from, like. What is that, 90 to 15 bucks right before my chart history starts. Give me an explanation here. Okay. Different company. Okay, okay, okay. Oh, duh. All right. Okay. So, okay, two different, complete different companies. I see. It's like they used a new phone number. You get a new phone, you get. You get a recycled phone number. You got all sorts of weird people calling you, potentially. Yeah. All right, well, anyways, let's talk about this one, because I like it so. Choppy history, lots of range. Okay? It actually, the first place it gets linear is to the downside. So it's getting linear to the downside. It bottoms. It stays linear. Now it's linear here. It gave you this real, like, wonky kind of first touch into the 20. Okay. If you're, you know, a G, you could have bought it over this left side peak, 39, roughly. Okay, cool. Which I did. And then I was forced to sell it when it closed below the 10. But now it's kind of flagging a bit here, so. So it looks good. Really? I'm not interested in, like, buying it at 53.50. I'm not interested in buying it at 54. I don't care. I'll buy it over 55 because, like, I don't need to buy it early and get chopped out for a dollar, you know? That's not even. What is that? That's like 2%, right? Like, I'm cool. This thing's going like, I wanted to go to 100, so I'm gonna buy when it's outside of the range. Okay, so you're pretty cool. I'm gonna put a little downtrend alert. Give me a little. Little sneak peek. But really, my line is 55. I'll let all you guys front run it and get chopped up. Who knows? This thing can go boom. Boom, boom, boom. You buy it over yesterday's highs. Like it like right now, like it closed yesterday at what, 51.61. Let's see how it's looking on the 24 hour. Okay, so it closed yesterday. Yeah, 5168. Right. So like you're still buying. You're seven, you're 7% away from, you're like basically an entire APTR away from the actual line. So I don't know, like, do you. Fine, you can front run, you might get. Every squirrel gets a nut. But like I'm not trying to fight, you know, for, for pennies in this little, in this little range. Like technically, price is smack dab in the middle of this flag. So like if you want to buy in the range, you might be great at it, do it, that's fine. Me, I, I'm, I buy proper size, I'm going to take it outside of the range. If it comes back to my average, I don't give a, like it's going to have to basically close below one of these moving averages or be a real failed breakout for me to sell. Yo, yo. All right, well anyways, NBIs, you're looking great. Will it trigger tomorrow? I don't know. Like I'm gonna put it on my focus list because I mean any of these could really trigger tomorrow. Like they wouldn't be the prettiest maybe. I mean Reddit could be decent. I already own some, but. All right, where were we? Let's go to ASTs, ass and titties. This one, this stock has been relevant for a long time now, a real long time. And it's just been a beast ever since this day, which was the ignition candle for a true ep. I mean that this is a legitimate ep. Nothing get, nothing bothers me more than somebody seeing an expansion candle on news and just being like ep, ep. Like, yeah, it just shows that people don't think. But this is true. It changed the course of this company's price, performance and their outlook, their long term outlook. And it's evident, I mean look at the volume ever since. It's just, the volume is up by a factor of, I don't know, 20 or something. 10, 20. And it's just sustained and it built this range and people tried to slap it down, slap it down, slap it down non stop, like non stop. Boom, boom, boom. 3, 4, 5, 6, 7, 8, 9, 10 times. And all that accumulation got unwound in this move up. It scared me. I wanted to short it because I was just like, oh, it's just a satellite company. I don't really got going on, but Dainty dips reminded me of, I think it was like, I don't know, some satellite company that basically looked like this. And then you woke up in the morning, they were acquired for like, you know, two and a half x share price. And I was like, I'm good on that. You know what else looks a lot like. Like these guys, they. They do satellite communication or satellite Internet, but SATL does satellite imagery, and it's a little thin. We'll stumble across this one on the SAE again. But this range is shaping up. It's chaotic too. Just like, just like ASTs, but man, it's got range. And when it goes, it goes. I mean, this is just like super linear. Poked its little head up, then it gave you this big expansion candle. Real smooth move. I mean, 200, 300% in 10 days. Sign me up, Sign me up. But, yeah, this is. It's building a real big range and it's. It's not doing the exact same thing. I mean, as ASTs, I mean, very different. I think the commonality is literally satellites. But that doesn't really mean. That's like saying, oh, you're a power tool. I mean, I guess if you're building more, becomes more important. All power tools, the. They'll all ride with or they'll all rise with a rising tide, I guess. But maybe satellite companies will. I don't know. A lot of. Basically that's going into space. Their. Their stocks are going up. So rocket lab going in space. It's going up. ASTs, ETC. Okay, so we were EST. Okay, shop looks good. Shop. Okay, so shop breaks this little steep down. Downtrend. So, like, how do you know when the downtrends broke? So I look at, like, bullish divergence. So that kind of defines the downtrend for me. And as soon as I see that divergence, like, I can basically draw it out in price. It kind of confirms that I'm drawing it properly. So, like here, for example, like, you have this, like, long downtrend in the macd, but then you also have like, this essentially. Like you can draw your line up here. It's like very similar, right? Show enough, you get across, get across. So, like, if I were to draw the downtrend here, the macd. Oh, it's wanting me to do it a little bit differently. These are called squiggly lines. For those who aren't familiar, there's a lot of controversy over squiggly lines as Opposed to horizontal lines. To me it's like, you know, can you clearly define a range? Repeatedly. While Maggie didn't use horizontal lines, he always used squiggly lines or. Or very subjective slanted lines. I use both. But for marking a downtrend that they're very valid. You cannot use a horizontal line to do that. So we broke this downtrend and now we have our first flag set up. Super tight day. And look, it's coincide coinciding perfectly with left side peak. That's that extra confluence I want. Give me that. I mean, do you kind of have this wick here? I don't know. I probably want to be too worried about it. Let's look at it on the weekly. Yeah. All right. So what's the high here? The high? I've been wanting to own. Own shop for. For a minute too. So 1562. So this is not a peak. This is super actionable for me. I don't know. My heart says it needs more sideways still, but if the market's going to rip and it's not going to go, then I don't know. But it. It looks great to me. I'm going to put another alert just for good measure. I'm going to put you on my actualist shot. I must have skipped. See new. I keep coming back to new. That little flag asts fslr trash. I hate vrt. Next bbai and what a shakeout candle. Like what Garbage price action. Just flag better. I'll revisit you. This was nice. That gap out of the flag was sick. That was a good one. Cubit holding up, man. Shut up. It's. You can't see the screen. No lies. Why did that happen? All right, we lost you at shop. All right, cool. Not too far back. All right, what I'm gonna do is stop the stream. I'm gonna restart the stream. I don't know why that happens. It like it blipped out for a sec. All right, what screen am I on or what a chart am I on? Can you see it now? No screen at all. Okay. Yeah. And mdb. I wonder though, if my recordings off. Kenny, you're. We'll need your recording for sure. Yeah, well, that's. All right. Let's go back to shop then real quick to see the lines. Okay, so shop. Oh man. You didn't get the whole rant on the downtrend. All right, I'll do that again. Okay, so like one way so down. Drawing downtrends can be pretty subjective, but I use the macd to kind of like be a backstop to my thought process on. On the price. I actually usually look at MACD first. So, like, I'll draw a MACD downtrend line like that. And then here I'll do the same. You can actually kind of draw in reverse, but like d. So there was a downtrend. Right. So then if I want to figure out the downtrend, like, is this a first flag setup? Like, it very easily. Like, this could be the downtrend. All right. Like, oh, that's a downtrend because it could come down further, whatever. But for me, the downtrend broke here when the MACD crossed up. So then we. If you look at the far left side of this line and then you go straight up, it corresponds to the top. And then essentially like here, I think. Yeah, something like that. I could take this one too, I guess. Very similar. Either way, you're within the same arena. So then this is like the first flag, right? And then this line corresponds near perfectly with this left side. Peak, super extended earnings gap up didn't do anything for almost a year. And now we're tight. Higher lows, moving averages are super duper tight. It looks good. If the market's going to push higher, Shop should go. Shop is lagging as a. As a tech company relative to the leaders, but that doesn't mean anything right now. I don't think. I think we're in the early stages of the big push, to be honest. Let me draw my line back, though, because I actually had instructions here for myself at 115. What was the high? 115.622. Okay, so what's a peak? And then it'll be 7.5% to 10% somewhere in there. Okay. And I think I've set like 10 alerts, so we're good. All right, next. I hate the stock. BBAI piece of CCL is awesome. So same thing, Same thing. This is like the DP setup. If you, like, if you're in the server and you go back in like a year ago, I literally said, you know, the next big moves are going to come from the dps. Of course I missed them all. I was like, I'll be ready. I'll be ready when it happens. And like, it happened. And I'm like, all the DPS this time are going to happen above the 200. So I was wrong on that front and I missed them all. But, like, literally every single. All the tariff bottom reversals are all divergence pivots, every single one of them. So I'm really good at drawing these downtrends. Kind of pro, so breakout. Okay. And then here's the first flag. And then this gap up was totally viable, but then you also had first touch. I'm using, like closer first touch. I'm using all this new language because I just discovered it today. First flag, first touch. Today is the first time I actually had that breakthrough because, like, I've been trying to explain how I do a lot of these things, I guess naturally or I don't know, I just look at the charts, like, and I kind of see them. My mind goes big move up, pullback, undercut, get linear, get tight, all that. But I like, there's a lot of steps there. And each one of those could, like, you know, there's a lot of room for error, I suppose, in interpretation. But first flag is kind of hard to mess up because first flag comes after a downtrend. It was just. It's. It's the exact same thing that I've been explaining, just using a different term. So, yeah, it could. It doesn't have to be out of a downtrend. It could be out of a big base. It could be out of, I don't know, whatever. Big bases are easier to actually buy just out of the big base. But yeah, and. And our. Where we are in the chart progression in the cycle, most of these, most or every chart is coming out of a downtrend. The tariffs forced every single stock into a pretty hefty downtrend. And so once, once the downtrend broke, we get a kind of a big move up, like out of the downtrend. Some people were able to pick that. And then now we get these flags, and they're happening everywhere. Like, any stock that is worth a damn has done this exact thing. And they're all going to do, if any. If the stocks are going to meaningfully advance. All right, let's just rewind it. Every single stock got their kicked in and they all went into a mega downtrend. Right? Okay, great. If they're going to emerge out of it, the downtrend has to break. They have to put in a first leg, and then they have to flag. There is basically no other way except for going straight up. There's a few of them, there's several of them that have just gone straight up completely locked out. They're the hottest commodity in the market, the most desirable equities. That's why they are going straight up. But still, there's a ton of room for a lot of these other Companies to go. And CCL was perfect. I mean it was great. Okay, so like Qubit technically is the same idea. You have this big downtrend first flag. I mean you would have got stopped out in a few days, but whatever. Maryland bizzle. Yeah, I would like to see it. For me, I would like to see a break out of that. So like it's still in this long MACD kind of downtrend, but I don't know, you could take it here. It's under the 200, so I'm not super, super interested. Arm was another good one. So this is the tariff downtrend. It broke, it put in this real shitty flag and then if you're brave, you bought it somewhere in there and hopefully you're still holding it. Good move net. So net gave. Here's downtrend first flag. Boom. Been up ever since. I'm not interested in that. That smr. These all need more. A lot more sideways. A lot more sideways, but same thing. There it is. First flag. Could have bought it the next day. Price would have came right back down on you. But whatever, if you're trailing the 20, you'd still be in it. Once I get done with this first scan, guys, I'll, I'll, I'll do some Q A and then we're gonna move on to the small account stuff. Same thing. It's just the same pattern over and over and over and over and over. It's great because I mean when you have like a macro event like the, the tariff news cycle, it just affects all the charts like negatively in the same way essentially. So they're all going to spring back in the same way. There's no really other way. Either they're going to go straight up or they're going to give you a little flag or they're just not going to recover. Right. So any of the ones that just broke the downtrend, and this is my big blunder, like I should be, I should be full, I should be fully leveraged across the board and all the leaders right now. And it's just, you know, I'm still new at trading relatively so I'm still learning. But this happened to me twice now and it will not happen again. You can mark, mark my words on that. Airlines, they're kind of just consolidating. Airlines trend pretty nicely actually. Gotta wait for earnings. I'd wait for earnings on them. I doubt they'll front run it. They might. We're ghetto. Okay, this is downtrend breakout. Here's the first flag. Now it's consolidating under 204 APTR trade to half a billion a day on semiconductor. You're going on, you're going on sideways for sure. You're under the 200. That's fine, that's fine. Doesn't matter to me. I bought Core last week. Under the 200 breaks out perfect. Well, it could just retrace and the bed like a lab did, but let's hope not. And this was a, this was a beautiful downtrend break to first flag. Where were we? Okay, on gme. This is interesting. So RBRK never actually never gave a first flag. This was one of the ones that just, just. God, what's that like choo choo train, little engine that could. It just little engined its way up this steep slope. The most linear move ever. It's like the stock gods were like they felt bad for us. Like they're like Trump is just wrecking these charts, like just destroying these beautiful charts with his, with his tweets, with his Twitter fingers. And we're like, you know, the ones that were on their way to greatness, we're just going to let them rise and look at this trend, like low volatility just all the way up. So beautiful, man. So nice. And it hasn't given a flag. So this would be one that I would watch. This would be one that I would watch. Kind of rejected a hundred bucks real nice. I know it had a big donkey candle, but that's. People say that like, oh, the rebalancing thing, you know, whatever. Like it doesn't matter. But like at the end of the day, shares still get exchanged. People make decisions. So that happens in, you know, dark pools. If you're having the last minute session, like somebody's still sold a bunch of shares. This one's going on. Need more side risk because I do like it. Rbrk. Yeah. All the ones that have just gone straight up. Not many. They haven't really given any setups yet. So I expect action like this where it actually has a pretty steep selloff. Maybe down to the 20 or something. Down to the 50. Perfect, perfect, perfect. All right. Now this is an example of one that just never recovered. Tariff sell off super extended. Got the white magic candle. Super extended. Okay. Kiss of death, white candle. The white magic candle predicted the Trump tariff news. Oh, you got a downtrend. Oh, he broke it. Cool. No flag. Just been a shit slope ever since. Yeah, crap, crap. Hola. Here's. Here's one. So Core did the exact same thing, but Core much cleaner I bought a lab on this day, as I'm sure a bunch of people did. I bought it on 622, I think. Wait, did I? No, no, I didn't. I got lucky. I didn't buy it because I did not buy this one. I'd been wanting to. I bought it here. I bought it a couple days later. Yeah, I'm gonna get stopped out of it though. It looks like I haven't already. I need to check. I didn't buy it in my main account. I think it's in my mom's or something. But yeah, it. It just failed breakout. FBO bounced off 200 and then just rejected again. Like on this crazy volume. Maybe this is like end of day rebalancing volume. Nope. All day selling just shit. Like why is it lagging so hard? I don't know. But this has been a major point of rejection. Yeah, I just haven't been around to buy it. I've just missed it every time. Whoops. Shit. Let me. I don't even know if I want it. I don't know if it perks up and gets tight and kind of presses the 100 again. But then where semis gonna be? Why is it lagging so hard? I don't know. It's a laggard. Like cohr is kind of a laggard too. But at least it's. It looks better than this thing. I'm gonna put it on my knees more sideways just to pay attention to it over the week. Cls. This is one that got away virtually. Yeah, virtually nothing. Like no room to get in. It gave you this one flag, I suppose. Yeah, right here. That was it. And then it's just been up ever since. Achr. Achr. So ACHR is very clearly defined. Super high volume, left side peak. And price has been consolidating over it. I bought it this day and it basically crash and burn turned into. I didn't make any money. But if we want to look at it from the perspective of downtrend break. So this would be the downtrend break. And now it's putting in just a horrible flag. Like to me it needs to splay more sideways. It's just not going to advance and I don't know, maybe an EP or some expansion candle something or other news. I don't know. Looks like needs. Needs sideways. I'm not even gonna put it on my. Needs more sideways. I need sideways. A lot of sideways Airline. Delta looks the best. Delta looks the best. MACD Cross broke the downtrend. I mean this is brutal selling. Holy. They must have really. Yeah, Tariffs. Tariff scare. Stone really ran deep in the airline investors because, I mean, that is just brutal. It's like gap down, gap down, gap down. This feels like Covid selling. This is brutal. Brutal. Brutal pops up. This is the reversal day. Then it goes sideways. Flags, big move up. I don't even know. This is my. This is probably flag number one right here. Honestly, it looks like plug, which we're going to stumble across. Plugs below the 200. I like plug. This is cool too. It's probably just because I like love chart art, but it's cool when the. The trend line itself, like the. The moving average is the trend line. Like, it's like. It's actually like if I were to just draw a diagonal trend line, it's the same thing. It's kind of cool. Look how tight the moving averages are. And right before earnings, they report first. They report first. They're under the 200 too. I bet you it runs up this week. Look. Yeah, and we got 50 right there. This is nice. Oh, man, when do they report? I really don't want to own airline, but they're just down so much. They report on the 10th. Okay. Oh, shit, it's not even July yet. Oh, we got plenty of time. All right. You're going on actionable, bruh. Half a billion a day. A little slow, 3.75. But I got room. Believe me, I got room. All my fuck ups. I got plenty of room. This thing is so. I feel like Riot and Mara might have their day. Might have their day. But preferably it breaks this big old donker downtrend, comes up here somewhere and then puts in a flag and then it, you know, goes something like that. That'd be pretty dope. I'd be there. You know, I did that before. Not gonna lie. Did that exact same thing. Broke out, did that and did that. So hey, if it did it, did it once, do it twice, actually. I don't know. I think a lot of the chemistry has changed here. Man, that volume's insane. There's a lot of transactions that happen in here. This, this was a good one. Ccj. CCJ is the one. UEC is lagging, but man, downtrend break. Look at that perfect little. Perfect little flag. I love it when they gap out of the flags too. It makes it so easy. People are like, don't buy gap ups. Like, nah, nah, this is perfect. I even gave you another one. They're like, don't buy gap ups. And then don't buy gap ups. If you would have bought every one of these gap ups, you'd be up nice. And look under the 200. So this move started under the 200. Bam. 81. That's nice. NPWRO. Look at this thing. Look at this thing. That's a flag right there. Wow, that's some chart art. Damn. I know. This thing has a crazy chart history. Let's. Let's explore its past. Man, that would have sucked. You bought this breakout. You anticipate it. You got lucky. It comes all the way down. Wicks probably stops you out. Then it goes. And then what is that a couple months later? Comes all the way down. Holy. That monthly touch was good. That's why sometimes first touches are great, man. Because they're so low, risk goes lower, stops you out for nothing. But usually when the trend gets established, can keep going. Let's look back. Max one day. Oh, God. Oh, it's so ugly. So ugly. This is just the worst price action I've ever seen. See, but like, it's had. It has its moments of glare. You know why this is the worst price action ever. You know what? Because it's just a stupid big range, but then it breaks out of the big range and it's still terrible. Maybe because it gets. It's all right here. I don't know. This is. This is some. It has its moments. But see, like, okay, here's a nice, nice downtrend break. Okay, let's see how it actually acted. So if you would have bought like one of these. That first touch of the 10 was sick. So I give you 20 nearly in seven days. It's not bad. 30, 40. Not bad. Just because it has a high ATR doesn't mean that it's actually gonna like, put all that power to the upside. Like, sometimes stocks have a high aptr, but they actually don't go anywhere. It just like sit there and spin their tires. I'm going to focus on the recent. And from the bottom. Wow. Holy. That's 60%. Jesus Christ. 60%. 30 days. That's pretty insane. This is a nice flag though. I've never traded this stock. Never. True. So the chart history is like, not great. This moves good though. And it's all the moving averages are so tight. The only one that's sloping down still is the 200. I take it. I don't care. I'll take it. Let's take small size. It looks great. I mean, ignoring everything else. And it's in its lifetime. Looks great. Held this little peak, this gap Level closed above it. Yeah. Yeah. We in there. Okay. That's in no way. DraftKings is perked up. DraftKings been another super sloppy one forever. It was right here. This line is where I discovered the Pwnr. Left side. Peak. Big move up on earnings. Sells off. Find support on the hundred. You have this line here. 3450. I bought it right through it. Held it pretty long. It wasn't the greatest move or anything, but it really solidified that concept in my mind. Okay. This is just a ranch. I don't even know what to do with this. I don't even know. You can't even, like, draw a downtrend. That's kind of it right there, right? I don't know. I don't know. It just needs to get out of this chaotic mess. This is. I mean, this is like. If I was only looking at this. I was only looking at this. And probably. It's probably the right way to go about it. Starting to. Starting to build something. I'm not too interested, though. Oscr. It's hard to tell what it's doing here. I think it's stalling and it kind of needs to go sideways. It could just advance. Oh, it's 8:00'. Clock. Okay. Stocks are live. Interesting. All right, cool. We need to get through this Iot trash. Damn. Damn. Earnings. Wow. Look at that. Holy. This one has to go on These more sideways. That's. I'm gonna. I'll learn about this one later. I need to check some dividends, actually. Damn. Some of these moves have just been outrageous. Then a lot of stocks have just not recovered at all. This looks good. This looks good. Toasty. Finally. Toasty's coming through. Sorry, guys. I'm gonna speed this up a bit. I'm gonna put a lot of stuff on my needs were sideways list. And then tomorrow I will evaluate whether or not it's. It's good. It's good. Damn. This has really held up, too. This is gonna be a fad stock turnaround story. I was so right with this bottom pen. I just should have waited for the unr. All right. Damn Interact brokers. You were just slow as molasses. But this is beautiful. I mean, for fuck's sake. This is. This is perfect. Like, quite literally perfect. It's so per. It's like one of those ones that's like super slow, but it's just so perfect where I can throw like. It's a kind of a forever trender, you know? Get paid on it in a year. You're Just so pretty. I'll. I'll take a little bit of it. I don't want to tie up too much of my buying power. Cool thing is too. You get just really good margin rates on it over the like Max. Damn. This thing News isn't just a buyout rumor. So what up, Jordan? Can I explain? White magic candle. I don't even know what it is. It's magic. Oh, that was beautiful. This looks great still. I know that like silver probably doesn't look as great. Ah, silver. Unrw. Doesn't look that great. Doesn't look that great. But I will send an alert here just to remind me. Can I. I think I have to set a different alert features here. Create alert single at or above. Dan. This list is long. Forgot how long this list is. Oh, this one looks good. This looks good. Aptr 4/4 billion dollar volume. Not bad. Not bad. First flag. I own this one. Irene. Irene. Left. Grab. I'm interested in this company. To be honest. This is one that's on my like learning list. Whoa. Super sloppy. I need to like do something. But it's interesting. It's been around for a while. Just kind of hanging in there building a really, really big range. I don't give a about oil gas. Here's first flag. This. This can move. Let me look at its full history. Yeah, it's not terrible. I mean it's pretty bad. These are the type of stocks you just have to like shut your eyes and hold. Like I want to buy it. Like, can it go up for a year from here? I don't know. It's in the middle of this big range. It's kind of. I mean, it's the same pattern as pretty much everything else probably. Can. I feel like I like that. I'm not even interested. It's not trading stock. You only have so many turrets within my. My consciousness. Whoa. See this thing got really linear out of nowhere. And really tight. The channel is so tight. Like it went from this chaotic shit to like really, really, really tight channel. People want it, not me. That was a good one. This was a good one. This real tight flag. WGS is doing it. Nothing like super beautiful standing out, to be honest. Like, I find flaws in the mall. Fortunately. Wgs. I lost it. Oh. Yeah, that was good. Real, real clean downtrend line. I mean chaos, obviously. Chaos. But ignoring the. The chaotic chart history. It was still a real tight flag and a nice move up. WGS is shitty. Super shitty price action too. This is really clean. Whatever this is. Oh, God damn. This List is long, I think. Oh, wow. No, don't want that. Therapeutics. If I see therapeutics in the name, I'm good. I wish I could filter out company names with therapeutics in it or health or bio. That's a strong one. This is a real strong one. I want to short this one. I want to short it because it's about the running the monthly 200, and it's just up an ungodly amount. Those aren't great reasons, but it's really starting to extend here. Like a push and a fail. Red to green move. Something like that first red day, as Ariel would say. Or the guys who short a lot would say, I'm putting you on YouTube sideways, just so I don't lose. Lose track of you. It's like we're getting the bottom barrel. Whoa. Genie. Genie. Sport. Genius sports. What do they do? What does genius sports do? I sell, like, sports apparel. I'm guessing. Trash. Trash. Lumen's interesting. I want to see a perk up and, like, build a flag. Gary's Dale won that battle. Actually. Hold on. I wonder if my line's still there. That was funny. As right here. Carriesdale Nipple ripper line. Because they shorted it, like, here. I think it just does this to him. Oh, man, that's hilarious. The nipple ripper line. Say that 10 times fast. Come on, get to the bottom. There shall be no chart unseen. That's interesting. Leg. You don't say. It's not very interesting. Super slow, super thin. You okay? All right, cool. We're done. All right, I'm gonna pause here. Any questions? Any good questions? Called a frozen rope. I like that. I've heard that before. So the white magic. All right, so there's within this, like, see if I can find a good one. So there's this. There's people try to find when should you buy, When. When are stocks too extended to buy and when are stocks so extended that you should sell? And I've been kind of actually. Let me. Let me wind. Let me rewind that. There's been a pretty popular metric that's been going around. If it's, I think seven ATR above the 50 day, that's like a signal not to buy. Adding more exposure in the name or take a position. And it's all. If you're already long, it's a signal to trim, right? But as I started looking at that metric applied to charts, there's like, you know, three month long moves where every single candle is marked. Most people use a dot or they'll Use an arrow or they're colored, the candles, but every single one's marked. I'm like, what use, what use is this? Okay, I get it. Don't enter it because it's, it's extended. But it went up for another three months. I mean there's plenty of examples. I'm not gonna pull it up and look. So I was like, but, but overall the, the merit, the idea is sound, right? We want to, ideally we want to sell, you know, when the stock is extended or maybe at the nearing the, the height of its move. And then obviously we don't want to buy it when it's extended, right. So I'm been playing with, with the idea, combining a few overlapping metrics having to do with gap and extension over certain moving averages and then using MACD as like a fine tuner. And I'm starting to get some pretty good signals. So like Zeta is one, right. So the way that I'm approaching it is whenever you see a colored candle, ignore the red. Still playing with that. I'm trying to find like essentially a, a combination of, a combination of criteria that will cause a candle to go red. And when you see it red, you sell no matter what. I haven't got that far with it yet, but the white candles, I've gotten pretty far. And essentially right now when you see them, you sell 50% of your position. So if you have a TH000 shares, you see day one, say you were to buy this gap up, right? So when you see the white and the candles also light up white intraday. So if you're looking at like a five minute or an hourly or four hour chart, the candle will light up at the exact same time in sync with the daily. Because within this day candle there could only be maybe like there potentially could be like maybe an hour's worth of five minute candles or like a single hourly bar. So basically not to get too much into the weeds and I'm still working out, I'm still working out the finer details, but you would sell 50. So if you had a thousand shares, you'd sell 50%. And then the next day you would have 500 shares, it's white again, you would sell 50. So you would be down to 250 shares. And then you get this gap down, which sucks. So it probably would have put you at break even. But that's, that's kind of, that's kind of the idea. If you were to just trail this move or sell 50% on like day three, then you would been in a Lot more trouble if you were to buy like this move, you would have sold 50% here. Ideally, I don't want to see any candles lighting up. So like hood, no candles have lit up at all. It's not extended. And this is perfect because if you don't see any candles light up, that means the move isn't extended by the metrics, which means you just trail. And so the really the cool long term portfolio impact for me, and it's mainly, it's a portfolio optimization thing, I'm trying to, you know, grow my account as fast as I can with this little effort and risk is I don't, this could potentially be groundbreaking where I don't trim on day three or day five. Right. Because right now, you know, it's a big move up or I'm sorry, I buy it, it expands, I sell on, you know, day three or five kind of subjectively, but here, this could eliminate that at all, like the whole thing. And so hood, actually I, I didn't even think about this concept when I bought hood. Just so happens that I haven't trimmed anything. But it's, it's perfect because there's no candle that's lit. So instead of selling on day three or five, I would only sell when I get a lit up candle and that would be my trim. And it's always in increments of 50%. And so far, me running all the math and just going through zillions of charts and, and spreadsheeting it out and comparing different scenarios, that's been the most simple. And so the only time I would sell would actually be when it's closed below the 10. And it kind of depends on where your account is and where you are in your, your trajectory and what your plans are. It may not be totally ideal for, you know, accounts that are really interested in turning over an edge quick, but where I am, I want to hold, I want to have, you know, relatively large size and hold longer. That's kind of the idea. Let's see if there's a couple other examples. Look at Tesla. Tesla basically top ticks, top tick, top tick, top tick. This is an interesting one. Okay, so here, so obviously this was. When was this 4, 3, 24 had like this earnings big move up, huge move in a couple of days, 40%, pulls back, puts in this really beautiful first flag and then breaks out. Right? So this is an interesting one where you would have sold 50 on this day. So if you had a thousand shares, you'd be down to 500. You'd be down to 250. You'd be down to 125. You'd be down to, you know, the next. The next block, 62 and a half, so on and so forth. So you kind of capture the bulk of the move, and then you're not subject to this big donkey candle, like, this big red candle. So there's all sorts of, like, other ways I've seen people do this. And again, it all is kind of clicking in hindsight. Like, I. I was watching a video on this guy, I was using Bollinger bands. Like, I don't know what the they are, but when I plotted the white candles, actually, I can do that really quick. Let's see. So, like, magic, If I go line, okay, so if I plot as a line instead, well, it starts getting extended as price is above the line. And then you can sell at the very first close below the line. So that's a whole nother way I'm playing with it where if all the candles are white, you are pretty much on notice when it turns white, and then you sell when it stops turning white. That could put you in weird spots because, you know, you buy this breakout, it turns white, you're on notice. Where was the very first candle that stopped turning white? Well, I don't know. Somewhere up in here. So that might be another approach too. I'm still playing with it. That's why I haven't, like, debuted or anything. But all in all, has a lot of promise. And just some, like, back of the napkin calculations, I think it could probably increase my profitability by, like, 25% overall, which is. Which is pretty freaking huge. But it's nowhere near for me to implement it. Some of you may say, oh, wow, it's like, literally top ticking. If you were to use, like, the ATR 7 from the 50, this whole line of candles is probably lit up. So it's like, how do you know what to do? But, yeah, let's see if it lights up. Look at that. It's kind of looking like a cheat code. Not gonna lie. It's kind of looking like a cheat code, but I'm not gonna. I'm not gonna say that yet until I actually use it. Are there any ones that are white from the last couple of days? Yeah. Okay. Coin here, right? Coin, Coin, Coin, Coin. So I'll show you what it looks like intraday. Okay. So. So, yeah, like, all of these white candles are where it's over the threshold, essentially. So, yeah. All right, cool. All right, Let me see if anybody has any questions. And I'm going to move on to doing this. Like. Okay, could you say 5, 6 is kind of a first mini flag on CCL? Yeah, you could for sure. It's not like super defined. It's kind of choppy. Yeah. You can see like. So how do you define the beginnings of a trend? Right, like, that's a great question. Okay, so one, it has to be outside of a defined range. But then for me, it's like the surfing. So it's higher lows. 1, 2, 3, 4, 5, 6. Six higher lows consecutively. And each day it's so close to this moving average. One of the best surfing episodes ever is in Tesla. Tesla is. Tesla's a pro surfer. I'm going to show you this. This one time a few years ago when it had its parabolic move and the run up to it was just awesome. And it basically was just putting in higher lows for like two months straight. Yeah. So like, this is crazy. So like it never really. It never really broke out. I mean, yes, it broke out of this downtrend, but like it's just kind of an ascending wedgie. Like here was when it actually broke out of the ascending wedge. Okay. And that would have been the day to buy it. And then it went 50 in 20 days. Just insane, right? But this is like one of the best examples of surfing. If you look on the weekly. I bet it looks really crazy. Yeah, look at this. It's just higher lows on the 50 weekly. 1, 2, 3. I mean, non stop. And then as soon as these other moving averages start lifting off of the 50, the trajectory starts kind of increasing. You step up to the next moving average, then you step up to the next. So it's surfing the 50 and then you get this tap off the 10 to 20, and now it's surfing the 10, and now it's surfing the 5. And then it expands. So it literally steps up the moving averages. This crazy price action. I was like, never really seen anything like it. But yeah, that was wild times. Here's an. Actually, here's another little episode. It looks like, look at that. Surfing right up the five. Beautiful. This is what surfing is. This is a trend. Look at this. This weekly right here. Like, that is just insane. It's so tight. That's what we want. Like, that's. Those are just beautiful trends, you know, this is great too. And they go straight up. It's just a lot harder. I gave back so much money in this. But when they trend just real clean like that, then they eventually kind of have this blow off move. Those are the best. Like right here. Trend blow. Beautiful. Does FLR not qualify as actionable? I thought I put it on my list. I put it on my list. No, I mean it looks good. It looks good. I mean, it's a touch extended now, I would say, but it looks good. Down here Would have been better. We bought it right when you got the MACD Cross 523. Once the frozen rope breaks, it usually has a fast move down. I agree. And if you look at the. What is it? The RK RBRK frozen rope break snap. You're right. Look at that. Three gap down days. Did you look at ATR extension from the 10 day, for example? Oh, that's ironic. I mean. Yeah, definitely have. I've looked at all of the combinations. Okay, cool. I'm going to move on. So do this. Create. All right, sweet. So this is the scan that I'm using for the our account. All right. So I'm running two setups here. One is first flag and then first touch. Kind of the easiest really. It's just like, you know, big move up, pullback sideways. And then the other one is kind of like. Not really sure you can. But it could be the first tap off the moving average. So it's all the same stuff that I normally do. I'm just using different words to describe it. So let's. Let's hunt for some here then our opportunity set. Let's do. Just do the main scan first. Okay. ONS looks good. Yeah, look good. It looks like it's about to get a MACD cross up. It has this extension candle, which is a good line. See if it's a. It's not an even number. I like two I. For me, I wish it had more sideways. Some of the lower time frames look better, but. Yeah, I mean, it's putting up after the downtrend perks up. This is the first flag. Little more sideways would be great. Ideally, the best spot to buy it truthfully is just over this high, which is 2 bucks. So that's where we're going to put our line. $2. I doubt it'll be actionable tomorrow. It's a little far away. Who? That's not $2 high. There is. What? Why can't I see it? Oh, high. 205. Okay, 205. Same thing. This high. This high is 199. This high is 205. So split the baby. We'll go two. Two sounds better. It's not like it needs more sideways for me to like look really great. Like. Because imagine if it like hit this level. So you bought it in anticipation. You hit this level, it bricks you, then it comes back down. Then it kind of like forms more or sideways. Then it's going to look a lot better, right? And it gets really tight. It's going to look a lot better then. So I'm going to put you on an easy reciters list. If it gaps over and it has some like, like big news or something, okay, we can be there. But I'm not super, super excited about it. This thing I want to short. I know I said I wouldn't, but I'm gonna put it here. I'm just gonna. I know I said that I would take just those two setups, but it's kind of just free money for me. This one's, this one's interesting. Yesterday would have been a good buy. A unr of the five. So it's looking on the lower time frames. Hey, it looks good. Yeah, it looks really good. I'm gonna put it on my knees more sideways. I'd like this. If it like just went perfectly straight across through after hours into tomorrow. It'll be a really nice hourly flag. So if you were there, you'll probably be actually actionable. A low volume type day would be sweet too. But we'll see. That's interesting. This thing, me and a whole bunch of other people right here, we bought it. All of us. We all bought it. On this day 213. Oh God. Terrible event. It was my first. It was the first day of Robo Turd etf. I just. I was so excited about quantum. Huge blunder. Obviously. Thank God it wasn't like day 10 or accumulation. I had like some stupid ass position. Thank God it was day one. It still hurt. It was like a four hundred thousand dollar loss. But big move up pullback. Got a really tight formation. It's far away from the line. It'd be great if it like perked up through it and then did some stuff like this. I don't know. It's not there for me yet. This one's really got a gotta prove itself. Wgs like I was talking about. I like this little high tide flag. Its chart history isn't the best. To be honest. It's kind of. Kind of ugly. Pass VSAT in there. Coin. Coin. Coin is great. Coin is actionable. Yeah. I wonder why it didn't come up on the other scanner. Did it? And I just skipped it. Yeah, coin is actually actionable. For the small account. It's actually I would do D O N O. So it's first touch. So here's the first flag. This is the first touch. So you could have bought it yesterday off the five day, but now I would just almost buy any anywhere. That's like a tight five minute setup tomorrow. And I would use Friday's low as my. Actually, this thing's chugging along. It's got great volume too. What does this do? Oh, oh, it's AMD leveraged. That looks great. I'm putting you on my nizar size list. This one, this one has been chewing up traders for years. That is a really big downtrend break. Huge weekly Mac Bull divergence. It has been linear in the past. It can make stupid moves. It's just been choppy forever because it's building a donker range. But let's just face it, this is a monthly breakout. Riot. Really? I don't know. More time, more time. Abav, you can go here as well. BBAI needs more sideways for me, but huge volume. Serve here. Sa. This is beautiful. This is a great one. Huge weekly base. Pops back up, first flag gone. This is just really, really pretty chart. UEC looks good. I mean, I traded a couple times in the past traded one of these legs. I forget which one was. Might have been this one. One of them. It's chaotic, it's shitty. What's the other one? What's the main uranium name? I forget it every time. What is it? Somebody tell me. Somebody help me out. What's the main uranium name? You got UEC and then like the main one, the one that's going up right now. It's gonna come to me here any second. No, not Oakland. Yeah, ccj. Thank you. Points. Yeah, see ccj, I mean, it's kind of the same thing, but ccj, obviously more linear, more tight and way, way ahead. I've not really looked into either of them, but it's the same kind of V. This is way sloppier. I mean, this is a nice run. This is a good run here. This is where I bought it. Me and Vic bought it here. Yeah, because it. It was under the 200. Yeah, it was under. I bought it right when it was peeking over. Yep, there it is. Okay, so basically, first flag set up downtrend break peaked over 200. That's where I bought it. I didn't hold it all the way up, but I got the meat of it. It's kind of doing the same thing here though. So here's the downtrend break. I don't know It's a laggard. I don't know if we can compare the two apples to apples. Like is it in a laggard? I would assume it is, but yeah, if it could break out and kind of flag, that'd be cool. I'm going to put it on the needs more sideways just because I probably shouldn't. Like I'll go back through in the morning and really weed out a lot of the stuff. So like why are you not going up? Lunar good. NBIS is great. It'd be awesome if we just had, you know, another day or so. Even if it popped up and rejects and kind of just keeps building, that'd be sick. It's pretty shallow and it's kind of wide. It's not, it's not super tight. Like there's no, no setups right now that just look flawless to me. Which tells me, I don't know what it tells me, but it tells me that I don't have any charts that look flawless to me. Labu Boo. I've been buying you non stop. For those who, who know. Galaxy Gas. Galaxy Gas looks good. Blockchain infrastructure play, shitty chart history, but I don't know if it matters. God bless you. 100 move or 100 plus percent move in 30 days. Say less. Crystal clear left side peak. It's got a little bit overhead yet tight day or so would be great. I don't care. Like I'll take it over highs. Not in a rush but it looks good. Beat north sideways. Galaxy Gas eos. This one's just screwed people. This thing looks good. A little choppy. I don't know. It's got no. I thought it was. I don't know what these guys do. This one's up there. It's extended. You should have bought it. If I were to buy it, you would have bought it here on 610. Could have bought this 10 day touch the 200 touch ASTs. She gone. Yeah, basically everything's gone. Damn. This was a great one. I know some people caught this in the group. This thing was sick. I even had my line like perfect because then you had this one. So you had your left side peak on your extension candle. So broke the downtrend, pops up, consolidates left side peak, boom. Gone. And then it gave you like a touch there touch on the 10, touch like this. This was a great, great move. Really clean. 100% in 20 days. Like what more could you ask for? What more could you ask for? I'm not seeing a ton. Not seeing a ton. My Friends, there's a lot of stuff that looks great. Just needs sideways. This thing looks good. This looks good. But like just give me a couple of days. Only a couple days. That's all I need. Arqq is this thing too thin for. Yeah, that's why only, only 40,000 or 4 million dollar volume. TMC has been a ripper. Been not the cleanest, but it's been a ripper. Steady uptrend. You had a three day burst here. See I'm not like down with these three day bursts. Like it's finally trending here. Maybe it's going back into consolidation. I don't know. Three day moves suck. Unless they're like 100% pretty damn close. I mean 50% in three days is. It's better than a sharp stick in the eye for sure. Let's see what it did here. Oh yeah, I forgot I talked about this one with Kyle. It hasn't been the easiest hold, but it moves big choppy base. This was a great one. This was a really good one. First flag gone. That was a good, good small account plug. All right, I like plug. So Plug. Famous last words. So many. This is a soul snatcher for sure. So many people have tried to trade this thing big downtrend perks up on volume. Huge volume in here. It's misleading though because the, the volume sub graph is representative of how many shares are traded. And if the price of the stock keeps going down but val$volume sustains, you'll see a ramp in just sheer share volume. So it's a little misleading. It's really. At the end of the day I don't care how many shares trade, I care how much money is exchanged. Like if there is 10 trillion shares traded a day. But it's like, you know, I don't know a fraction of a whatever. Like in the crypto world where you have like $.00000000 $1 for like some of meme coins or whatever. Like yeah, they might trade a gazillion a day but they move like, I don't know like a million bucks or something. Doesn't mean anything. But the dollar volume here is actually sustained. So I mean it's. We're trading at like a dollar and it's still moving, you know, 100 million a day in the last, in the last 20 days. Let's look at the trend overall. I know, it's just like straight down. It's pretty. Jesus Christ. This thing though plug has made the greatest moves in I think stock market History. Yeah, yeah. Twice. There's two times. Go back and look at Plug's history. I'll do it right now. Believe there was two episodes. Yeah, yeah, yeah. The first one was just IPA. That is just. Just absurd. Come on. IPO went 800%. No big deal. It's not even that big by today's standards. This move, 1300% quick deal this move. I mean like this thing is just history repeats itself, I'm telling you. And there's. There's a lot of commotion around technology or around batteries and whatnot and, and charging and all that stuff right now. So I think even Elon tweeted something about batteries. But you have a big monthly bull divergence forming. I mean, it's, it is one hell of a downtrend. You can't even draw a line. I'm not going to bother trying draw a line. But like, let's look at maybe the weekly. Weekly. You might get a little bit better definition. I don't even know how you draw down trend line. You can't. Oh, draw it like here, like there. That's probably the best I can do. But regardless, it's broke. It. It's broke over this line on some good volume and now it's putting in this flag. It's under the 200, but I don't really give a. About over like 125 maybe. I'd give it a shot. Why not? Because if it does go like, okay, worst case scenario, I stop out for 1%. Right? Okay, that sucks. But if it does go, the thing's gonna go a couple hundred percent. So it's, it's, it's weighing risk, reward, but also probability of it making a big move. You know, if we, if we just take it back to first principles. It's big move up. Okay. Did it do that? Yes, did so. It went 60 in three bars. Okay, that's a big move. Linear pullback, undercut. Found support on the rising 20. Higher, low, higher, low, higher, low. It's getting tight. It's trying to close over the 10. Maybe like another day or so, maybe perk up, whatever. But I don't know, I'd probably say over the hundred day SMA, so that'd be over yesterday's high, which is exactly 125. Yeah, let's do that. I know, I know, I know. This thing's a major piece of shit. All it does is go down. Great. Said the same thing about cvna. Set another one for your measure. Okay, cool. You're going on actionable. Okay. Aspie just in a big, big sloppy Range Tigers getting close. I'd love to see it just perk out and build a flag. But over 10 is enticing. You're going out sideways. Aoi, you should be on. Needs more sideways. You broke the downtrend. Congratulations. I guess you could count this as first flag. I'm not going to though because it barely advanced. It needs to build a flag. I'm not even going to put it on. Let it, let it keep going. This thing. I bought it. I should still be in it. I sold it though. I bought it. Was that Friday? No, Thursday. I bought it Thursday. I was just demoralized seeing a gap down being up being up as much as I was just to see it all go away. I just sold it. I shouldn't have it should still be in it. But the line is still there. So it's 50 bucks. Can buy it back to 50 or you could wait. I mean fact of the matter is it, it doesn't. It's kind of elusive. Curious what this one looks like in log. Okay. It looks actually more appetizing. It's like a high base. It's like Wyoming of stocks. I mean that's absurd. That's a hell of a move. 250% and really we want to actually measure it 230 days. Beautiful. It's been this long, really big base. Everything's getting tight though, man. Higher lows, I mean it's still here. We still here. It's non stop. Higher lows, non stop. Higher lows on higher volume. It's got a high short interest of about I think 20%. It's got a 30 million share float. It's in the right places. I was actually reading into them a little bit over the weekend and the majority of the revenue comes from one large Mag 7 company who have, they haven't disclosed but supposedly they're. They're going to be catching a bunch more contracts. They operate on contracts. So they essentially organize companies data and make it AI ready. Right. So they'll like organize, organize their data and they'll tag it and they'll annotate it and they'll just make it more usable, more digestible for large language models. Yesterday was super tight inside day. I don't know. I'm a glutton for punishment and I know, I know that I'm just going to take normal size. So if I could stop that. Again, no big deal. I can't deny that it has a very clear line and it hasn't sold off. Hasn't broke down. Moving averages are good. A little sloppy. It's in a range. You know taking the first flag out of it would be ideal. Pressing highs but I don't know. There's something alluring, alluring about it. I'm going to put it on actionable. You can hear the uncertainty. Like 10% position. Even though I should probably take more. Okay, we'll see how it goes tomorrow. I rxrx I know I could just skip you oust I have a. I bought it this day so whatever this is. I have that average 20, 2050 roughly. I don't know. It doesn't look too hot but who knows. This has been a really great buy for those who. Those who caught it early. I think Zen in the group, he caught it really early. Probably caught it like here. I want to say somewhere here it hasn't given like many opportunities to get in. You could have bought. So this was the downtrend. This would have been the first flag. So you could have bought. What is that? 528. But even if you missed that there was plenty of really clean touches. So 535 2. I mean every single day. I mean this is really nice surfing action. Like this is what you want to see and so you could have picked some up off off the five day moving average and it just closing the five day moving average. I think technically it did here too but really barely has actually on Friday barely closed below the five day. I don't know. It's been a really, really nice trender. It's a really great move. It's been a really great move. Pony was interesting. It needs to buck up. Needs a buck up here. Get over, get over this level, whatever this is 1580 and kind of build a flag. But I think they're ev right. Yeah. Ron PDYN yeah, just building a big base again. I'd like to see it perk up and then give me a flag. That would be ideal. This thing doesn't do that though. You know like it doesn't obey by the. By the laws of the universe. Just kind of like just go straight the fuck up whenever it wants. Just out of nowhere. Like I'm just going to go casual 300%. It's very news driven. I haven't looked into them. I know they do robotics. It's got a big downtrend to break. I don't know. It's whatever it's. It's just building a ranch. It needs to get linear and it needs to you know show me that it can play by the rules. MP was a big move. Okay. This thing, this thing, this thing. Okay, so downtrend break, first flag. I know a lot of people bought it on Thursday. The problem is the line was up here is 450, right? So the people that bought it on Thursday bought it way down here. They bought it 13 away from that line well over an apt ROI. So now the line is this high, 464, which is just kind of some random ass number, right? So you don't really have much. Many touch points with this 464, which is the high. See if you have any on the weekly. Sort of, sort of, sort of. Not really. It's kind of. You don't really have any touch points, but it is making higher lows. It looks good. A couple of tight days would be great. Like, I'm okay with less touch points if it were to be pressing the breakout line. Like if it had like 1, 2, 3, 4, 5, like 6 days and all the moving averages are kind of curling up and it's kind of pressing it. I'm cool with that because I knew you're super low risk, but buying mid range and you get stuffed. Like, you know, no surprise. Like, doesn't surprise me. This one goes on these or sideways. It is in the whole quantum theme. But it has a very different chart shape than the others. I mean, overall, big move up, pullback, perk, flag, they're all doing that. But this one's kind of like flat, like a pancake. Am I still in log? Is that why. No, we'll go to log. Okay. All right. Now let's get out of log. Qs. Interesting. QS is the ultimate gap and crapper. But one thing that I've noticed over the last like year or so, every time it does the big gap up, you know, the infamous QS gap and crap, it's getting. It's having more staying power and the moves are getting bigger. Like these are the two extended. Like the last two have been really extended and the volume's getting bigger. Obviously the price is going down. So like what I said on Plug's chart, you know, share volume will go up as price comes down. Still though, there's something here. One of these days it will actually stick and keep going. And I'm sure there's some big catalyst or some big milestone. I read the news. Well, I didn't even read the news. It's probably all I need to do is see it actually flag for real. Like this one kind of did. Kind of did. I don't know, this one would have to have to really prove it for me though. It would have to kind of really advance and build a flag. And a lot of news and like maybe analysts upgrades, something. I haven't even looked into them to it, but if it's gonna make a meaningful move for. For a prolonged period of time, it'll pop up on the scan slot. All right, we're done. Scanned. Sweet. All right, any questions? Ccj. Ccj. Ccj. Thanks, guys. Lou Leu. Yeah, I saw somebody bought it off the 20 last week. This was also a sick move out of a big base. So downtrend, voila. Breaks it. Okay, first flag. Beautiful. Okay, first flag. Then you could have bought it on this day. Then it breaks the base. Retest the base. Could have bought it here. Kind of choppy. Not like the tightest range, but still really nice. I mean, it did like, look at it. Look at the touches off the five. 1, 2, 3, 4, 5. Sick. I don't know what you do with it now other than. I don't know. I don't know. You do with it now. Looks it was. It was a good move if you were nimble enough to catch it. Oscr is gone. Nothing to talk about there. Invz. It's weird talking. Oh, yeah. Okay. Oh, I see why it's super thin. Looks good, though. Looks good. Makes kind of weird moves. I don't know what the hell this thing is. It's all right. I'd like to see a little bit more of a flag, but maybe tighten up a bit. But this was. This was. I don't know. Looks okay. Actually. I need torn sideways. It looks like. I'm sorry. More sideways plug. CFO bought a million over the last couple of weeks. Tight. What do you think about op? Every time I see a ticker that wasn't on my scan, I'd like my ears perk up. Looks good. It looks good. I mean, that's like a really perfect kind of wedgie thing. I don't know if it's. I don't know what it theme. It's an ocean, pal. Is that. I mean, it's super tight. Volume. See, the volume's really dried up, though, on these. I want to see the volume sustain. There's. If the volume has not really sustained it at this perk day. I don't know. It's hard to tell. I'm kind of out of this game playing these. It's really tight, though. It's really, really, really tight. I mean, if your size is small enough, like, I Don't see why you couldn't take it over, over yesterday's high. I don't know what they're. I don't know if they have an offering. I don't know what, what the deal is with them. One thing that I don't like is volume hasn't sustained throughout every day. Like it's gone flat virtually and you got a macd cross down and. I don't know anything else about them, but. Yeah, exactly. Yeah, yeah. Oh, conflict. Shipper theme. Yeah. No, I mean the volume's completely dried up here. I don't know, like, I wouldn't be. I would be more surprised if it went up than down. Like, I could see this happening. Watch tomorrow, it's just going to go straight up. I could see something like that. That sounds right. That looks right. That looks right, doesn't it? Looks right to me. Yeah, exactly. Exactly, yeah. Conflict's over, so there's that. I mean, I'm surprised it held up this far. What, on the hope that Israel just missiled the out of Iran? All right, any questions? Anything you want me to talk about? I got a little bit of time if you got some good questions. If not, I got some other stuff to work on. Cool. I'll let it. I'll let it go for a sec. Beautiful. We're going to be locked out. I'm not going to go over like. Like, I'm not just going to go over tickers. I mean, if anybody has any, like, there's. There's unlimited chart examples in the server. Like, if you have an idea of, like, what it may be, just go look at the charts that are in the server. Like, there's so many there. There's so many. And more than likely, if it didn't pop up on my scan, I don't know, there's probably, probably not a lot going on. Yeah, I can. Jack. Let's say I'm still working on it a little bit. Pull it up. All right. You can ignore the slippage and the commissions. It's built in Python, essentially it looks at your win percent. So you can have like a 1% low and then a 1% high and then it'll pull a random number, but there's weights. So in the middle of the, the curve for like win percentage here. So like it would say like, for example, if I went like 5% to 10%, right. And so the outliers. So like 5%, 10%. It would, it would pull random numbers, basically. It would pull the median, like seven and a half lost percent. Hard stop at one but you could pop it to two. And then I built in like Black Swan chances like one out of thousand. It's probably less than that. But where you may get like a market wide gap down and your positions could be down 25 to 50% overnight. Still need some work, but I found that it's better than all of the online sims. I need max losing streak and just kind of some other variables that I haven't really thought of yet. Tilt. Like every once in a while there's a tilt factor or there's a technical error like how often, how often we blunder a trade that you're already in. Stuff like that kind of outlier. But let's see what this, the simulation pulls. So this will run 100 simulations, over 500 trades. So like if we did just like set the account to like 25 grand and then do just say you do one trade per average trading day. It's 252 days run it. Oh shit. That's not good either. Yeah, There we go. So over 252 trades. This simulation says the median account value would be 182,000 the best if you go on like some crazy streak. 600,000. But that's essentially how it's set up. Like what are, what's your range of winning percentage? What's your range of losing percentage? What's the frequency factor in some like Black Swan events? If you like look really closely you can see like some opposite of Black Swan events. Like some, some big moves up. I don't really see any that were produced low. It's probably setting wrong. But yeah, I mean that's basically it. Can you talk about the mindset you need to make millions? I mean probably not that mindset, whatever that is. Yeah, I don't know. I'm not even answering questions. Okay. How did you approach position sizing for inod? I think I jammed like the whole small account into it. I know that. But the way you should have bought it was over 50, you know like 10 15% because it's kind of already extended so price opened here. It's already up almost an APTR into that line. And you still have this peak here which is where it rejected. So you could buy a cheat back through 50 or really you could just wait for it to breach where it rejected 52. It's probably more responsible to do it that way just like any other size. I mean like any other stock. Like just buy one size. Like if you're not, if you're not consistently Profitable over a couple of years. There's no point to use dynamic position sizing. Just use 10. Period. End of story. Don't, don't size up, don't size down. Just use 10. If the stock meets your criteria and you have a line and it's. And you can execute it, just use 10% today. All righty. Good questions seem to be in low supply this evening. Or questions in general. So that's good. That means you guys are getting it. Well, you guys have a great night. I will be around if you need me. Holler. And until next time, you know what? I want to. Oh man, I forgot to go over the SAE Stu. I don't know if I want to do that right now. This is cool. I do like this. Yeah, but this is the continual improvement log. The way that it works is a week over week log where you have all of the various components of your, of your system here. So like just a task list, my mission statement that I can compare everything below it against the high level rules setup. Scan your rules for executing your daily workflow, weekend workflow. But it's cool though because to expand them all, you would pencil in all your rules, just all your thoughts and whatnot. You can use up here as like a little like notepad, a little thought thing. And then when you get to the next week, you just copy and paste it over. But every single time something changes in your rule set, you need to, you need to record the change. It's a change log essentially for your rule set and a continuum improvement log because it forces you to critically analyze every component, every line of your, of your rule set. Like right now I already need to add a second, a second setup which is weird like to change this from daily driver to first flag and I need to redefine that. Actually I should probably do it. Yeah, whatever. I'll just change the first leg. But anyways, I'm not going to go into it make all the changes now. But you know by. As you work your way to the right, the changes should get less frequent and less frequent and the all of the criteria, all the content should get more and more refined, more simpler, less complicated. Like this will have from an execution rule set perspective. It'll have the trims and then it'll be like white magic signal only that's like the goal. And actually I'm going to run it with this account. But yeah, I thought this was really cool. It's super simple. You guys can make a copy of it and keep it, use it yourself. And obviously Adapt it to however you want. But you should start seeing, you should see far less green wise and more ends and eventually gets to the point where you just stop even filling it out. Like you may have like a, a monthly or a quarterly review. It doesn't, it's not weekly in the beginning, weekly makes sense. But as you, as you progress, it should be become fewer and fewer. Does anybody have any questions on this? I'm down to answer some. If not, we'll, we'll move on. APTR so it's average percent true range over 14 days. Oh, okay. APTR 1. So the average percent true range from one day ago is less than the 14 day average. So if the 14 day average captures the body of a contracting pattern, a wedge, then we should assume that it's larger than one day ago. I mean that's what we want, right? So we want it, we want it to be tighter. We want the, the range to get tighter essentially. Hey Matt, you probably missed it earlier. I'm not gonna release it until it's, it's done. And I actually have, you know, have, have like solid rule set around it. I've never actually released an indicator with a rule set before. I'm really, really, really weary at doing that. You know, at the end of the day moving averages really are all you need. If you just sold below the first, you know, the 10 day or the five day, you'd be, you'd be great and you just focus on, you know, catching trends early. But if this does turn out to really work well over time and through all sorts of different market conditions, I haven't had enough time to really go back and look at thousands and thousands of charts. I need to go to like on demand and, and go through the various years and just go through a ton of charts. And I mean so far it seems pretty good, but you really don't know until the heat of battle. The problem with again the 7ATR extension is there's so many can when you use that indicator. There's just so many candles that are lit up and it, and I see people use it but it doesn't mean anything. Like they don't actually do something when the indicator occurs. Like when price closes below the 10 day SMA I sell, right? Like I just don't have it there for fun. So when, you know, when the candle lights up like with the white magic and it needs to signal an actual action, it can't be like oh, the white candle's up. You can do this or this or this or if you don't feel like it. It's okay. It's okay, sweetie. You don't have to. It's fine. Like, no, that. Like, if the candle is white, you do this. Period. Editor. Once I get it to that point, I'll let you guys have it. The edge will probably. I don't. I don't think the edge will erode. I don't know. Who knows? Who knows? I. I doubt it, but. Well, yeah, I would. I would definitely. I would definitely say that. I wouldn't want to be buying here. That would suck. That would really suck. Also would not want to be buying here. Out. That would really suck, too. Okie doke. See you guys.