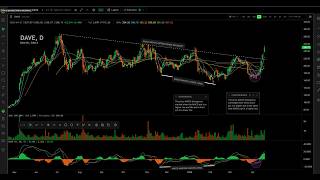
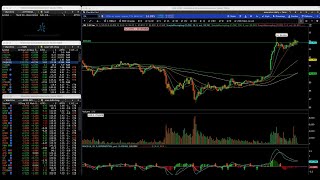
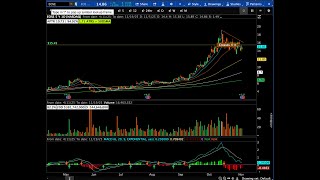
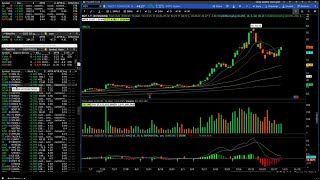
Chart Talk Ep. 6 | Think or Swim Setup for Swing Trading
Alec Riffle sets up Thinkorswim for swing trading from scratch: seven watch lists, scans using APTR and dollar-volume filters, custom columns for earnings and hard-to-borrow stocks, two workspaces, and moving averages plus MACD. He walks through each configuration step.
Chapters
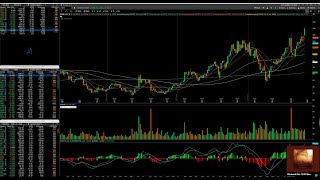
Morning, La. All right, so this is going to be chart talk episode 8. It may be split into multiple episodes because it might end up being kind of long. But we're just gonna roll with it. Can you hear me? Holler if you can hear me. All right. Sweet, sweet, sweet. All right, cool. Thanks, guys. All right, well, we are going to perform a. A toss setup from scratch. So what you see in front of you is it's a family member's account that literally just got opened. It was like two. Two stocks in it. Not a lot of money in it, but it's fresh. So I didn't have to like, set up a new. New desktop or anything. Just. Just logged in. So this is basically. This is what you see. Actually, you know, I did change one thing. The. The link number comes stock as red, which is terrible contrast on the blue. You can't see it. So while I'm on it, I'm just going to change it to yellow because I can see better. Okay. So on the right side of the screen, I kind of like this little agenda. There's going to be things that I'm missing. The, the actual progression through the setup, you know, may not be super efficient. You know, this is my first time doing it. I'm just going to do it live, you know, one take, no, no redos, none of that. And just kind of, kind of work myself through the list, the general setup, setup, menu, account info. You know, I'm going to start with the watch list column. So this far left side of the screen is what I call just kind of like your watch list column. It's like your. Your left navigation, essentially. And so I'm just going to start by deleting these gadgets because I don't care about them. We're going to start super fresh. Okay, so we need to set up 1, 2, 3, 4, 5, 6, 7 watch lists. So that's what we're going to do. One watch list, two watch lists. There's going to be a lot of redundancy and repetition because I'm literally going to set this thing up as if we are going to. To actually use it. There won't be any skipping. I'm not going to pull, you know, scripts from anywhere else. We're going to write the scripts raw, using AI right on the fly, like right on the spot. So there will be, like I said, absolutely nothing behind any mirror or any. Behind any wall or curtain at all. We're going to get this platform set up so that it's so that I could actually trade with it and execute on Monday. All right, so I'm going to have 1, 2, 3, 4, 5, 6, 7. Okay. Two other things that I want are my message center because that's where the alerts come through. So we're going to add the message center and then I like having Trader TV on. So I'm going to take Trader tv. You have this little drop down. You can watch CNBC commercial free during the day, but we're going to turn this off. All right, so first one's easy. First in order is our focus list. So I'm going to create a watch list. I'm going to go number one and it's just going to be called Focus Focus. If you've watched my other streams is the list that contains my manually chosen actionable setups for the next trading session. So it is blank right now. The next one is my needs more sideways list. So I'm going to create needs more sideways. So number two. Cool. Okay. So then we got focus and we got needs and we're sideways. Now these are actual scripts that we got to write. So that's what we're gonna do. I'm already recording it, robot, and Dr. Luca is recording it too. So. Alrighty. So let's pull up chat Jpay Tay. Okay, Boom. Let me get one of these little mini windows. Test. Perfect. All right. Write me a think script that filters for stocks based on average daily range percent length 14 days minimum 5, and then daily average dollar volume over the last trading day, minimum 30. Rewrite the script so that it's broken into two sections. The top section should be inputs, ones that I can edit and control like a console. The second section should be calculations. Okay, this looks like it should work. All right, adr. Okay. I don't want to use ADR though. Instead of using adr, let's use the native. Let's use aptr, which is native to toss a PTR average percent true range. So aptr will. It needs to use. It actually needs to use aptr. I think. Yeah, I think I can do it that way. Let's see, APTR calculates or accounts for gaps. ADR doesn't. So I prefer aptr. All right, so what I did was. So we're on these chart. We're on the chart tab. I click scan and then I go to Stockhacker and it has like some default scan in. So I'm going to get rid of all these. I'm going to remove condition group. Remove condition group. Okay, cool. So I'm going to add. Let's See, I think I got to add a filter stock pattern study. There we go. All right, now I'm going to go to custom and then I'm going to open up Think Script and then I'm going to paste that in. I think I can use just aptr. I want to say that works. Oh, full disclosure, I am not a programmer or a coder or anything. So I'm just going to hack it all together with ChatGPT and it'll get it all, get it all working. I'm just gonna like fix this and it'll figure it out. So. Okay. Yeah, but it's not using. I wonder if I can, I might cheat and use my. Look at my other account and see outside. I think that works and if somebody is a programmer in the chat, just, just tell me what I'm doing wrong. Nope, that doesn't work. You know actually that should, should be fine though. Let's see what the scan results come up as. Okay, well I need to set this up because these are all the default columns. So we are going to basically remove all of them. And I'm going to add mark percent change. I'm going to add aptr. You know what, that is actually not working. I'm going to look at my account since I have it up over here. Perfect. All right, I lied. I'm going to cheat. Okay. There's a super simple scan. All it does is look for average daily dollar volume over 30 million and then 80 APTR greater than 8 over a 14 day average. Now the specifics as to how you set this up should be based on the, your net liquid. So it's just, it's a multiplication factor of, of your net liquid is how you should set dollar volume. So there's different ways to do this and it kind of changes as your account grows. But I think that, I think, you know, a small account under 25k could just be fine with like a 20 million cutoff, you know, because any, any stocks, they're going to make really big moves. They're going to put in more than likely they're going to put in more than 20 million average average daily dollar volume. You know, you may miss some super small ones. Like if I was, if I was running it super aggressive and by the book, I would use a multiplication factor of my net liquid. I don't want to say it off the top of my head because I don't want to, I don't want to be wrong, but it would be like, I don't know, like a 10 position on your account should get you. If you multiply the 1010 position in your account by a hundred to 200, that should get you pretty good as to what your cutoff should be. And obviously, as your account grows, that may change some. Let's. Let's see. So if your account's 25,000, which is PDT. Whoops. Okay. And then 10 position times 200, so that would be like 500,000. Like we're not gonna. Like, that's, that's just too small. So I would say like the smallest, you know, you could say. Let's just say 10,000. We'll put it at 10,000. All right, now I'm going to run my scan and we're going to see how many names actually come up. I don't want more than 100 names. So what I'll do is I will. You know, I probably have to add. Okay, I got apt right there. All right, cool. You know, it's weird sometimes on the weekends, toss doesn't give bandwidth to like calculations. So, like, this is a relatively simple script. It should run no problem. It's just. I don't know why it's so slow. Yeah, I like. I like dollar volume based on one day. Dr. Luca. Because sometimes you have stocks that literally come out of nowhere. Like if you look at serves Nvidia EP last year, like it had zero volume until that one day and it maintained the volume. So if you had a 20 day average, you probably still would have hit the $10 million volume, you know, cut off just because that, that EP day was just so massive. But yeah, I don't know why this is not loading. It's kind of a bummer because it's pretty critical that this loads. I'm going to save it. So let's. Let's name it properly. All right, so save it as. So this will be the. Everything that I do in the platform will be very, very deliberate. The way that I name things, you'll see and I'll explain it kind of as we go. Okay, so we will call it. I'm just gonna name. I'm gonna name it number three. So number three. Okay, three. It will be aptr. Greater than. I'm gonna call it 8 because that's what it's set to right now. And then the next condition was dollar volume greater than. I forget what I had it at. I think we agreed on 10 million, right? So 10 million. Cool. Save. I'm just gonna double check every single time you update the scan. You gotta. You gotta resave it so yeah, it's good. I don't know why it's not loading, but. All right, we got one man, so that's going to go in position three. So we have our focus list, our needs more sideways list, and then we have our first scan. This is really the only, like, scan scan. This is like the daily driver. I'm not really. I don't have any other use of any other scans except for earnings scans. I could go into setting those up right now, but it doesn't look like anything's loading, which is kind of annoying. I don't know why. Why it's not loading. Let's see if it loads on my other platform. Or if anybody is on toss currently on. Currently on their computer. Let me know if you can get any scan load. Okay. Yeah, they do this from time to time and it's kind of a crappy, you know, kind of bad luck, but whatever. Maybe. Maybe by the time we. We get done with setting these up, some of them will populate in the left nav. All right, so let's just set up the earnings scans. Earning scans you can actually just do with the wizard. So we'll go. Custom. Whoops. Okay, maybe this will work. Write. Think script for. Add the criteria. You know what? We're going to. Add the condition, add the input, See if that works. Yeah, it kind of sucks because I'm building these scans out and I can't test them if they work live. So we're just gonna assume that they do. And if, if. If for whatever reason they don't load by. By the end of this, I'll go back through and test these scans and I'll just post them all in the. In the actual. The channel, the. The toss scan channel. And I'll make sure that they're all working properly. But this is just kind of for demonstration purposes. I. Yeah, I'm almost like, we should. Oh, this is a weird bug. Like when I go into chat gbt, it doesn't allow me to enter text into other windows. I have to open a text editor. It's some strange bug. I can get into it. There we go. Okay, so, okay. Has earnings. It's rejecting this. I forget what the actual call is. We can do it like this pretty easily. We'll add another filter. Condition wizard edit. All right, so now we're going to say. I think it's like, maybe it's a function. No, it's corporate actions. Earnings. Has earnings. Has earnings. Negative one means that it has earnings tomorrow. 0 is. Has earnings today. So that should do it cool. And I lost the other condition. It's not as important, but some days there's a ton of earnings. There's just like, you know, 100 or 200 names reporting and I don't really want to see the names that like have zero volume or no range. So we should weed those out. So we're going to add, add another filter and then we're just going to basically add that first scan. I don't know why. Get rid of that filter study. Cool, huh? That's bizarre. Oh, all right, cool. So this will be our has earnings tomorrow. So I need to actually set it to after hours because there's no watch list column where you can differentiate after hours and pre market. So you have to have one scan for each. So this one will be after hours. Okay. So we're going to save this one. So it's going to have the same. I'm going to use this as like a suffix and we're going to call it number 4er after hours. Okay. And then it has the same APTR setting or input and then the same dollar volume input as our daily driver probably will tweak it a little bit because you may want to see there might be some slower names, you know, that are, that are reporting that are worthwhile to catch those EP kind of momentum bursts. So you may, you may drop it to like 5. So why don't we drop it to 5? So I'm going to update APTR 5 like I would like. Unless your account is $10 million, there's literally zero point ever, ever to look at a stock that trades under 5 APTR there. It's just a waste of time. Like if you don't value your time. Yeah, I mean like, you can look at Google, you can look at Meta, you can look at those. It, it's just a waste of time. It's literally noise. Like when we set this up and you know, I'll, I'll kind of do like a grand kind of like recap. We'll go back through it all. If you see meta produced anywhere, I did it wrong. Like we, we should not see Meta. We should not see Google. We should, we shouldn't even see Nvidia. But you will see their double and triple leverage counterparts. I wish, I wish this, the discord like scrolled down automatically so I can see comments. I said there's nine new comments, but all right, whatever. Okay, sweet. So let's save this. All right, so this is number 4er after hours. And then we have our, our volatility greater than 5 and then our dollar volume greater than 10. Sweet. Okay, we're gonna do the next one. So now we're gonna do. Oh, wait, I just did. Tomorrow we're gonna do today. So it's. It's literally the exact same scan. We just change the negative one to zero. Okay. Voila. Save. So this one would be number five. Whoops. Five after hours. Aha. Tomorrow I need to go rename the other one. I forgot to type today, so I'm going to load it personal. Er. Okay, now we're going to save this one. Come on. Save it as today. And then I'm going to delete that other one because we should have two. Yep, two fours. All right, you're gone. All right. Oh, can I delete these? Yes. I can delete default indexes and quotes. So I'm going to delete all three of these because they came stock. It's been a while since I've set a platform up from scratch. They just throw all this crap in there. Whoops. Delete index. I want to remove anything that produces noise. I want to remove everything that's not premeditated. I don't want to see anything at all that is outside of my system. Period. End of story. Like if there is a single input or indicator or criteria that I do not deliberately use within my system, it needs to go away. You can't have it. You don't want to see it. It's a waste of time. It's a waste of time. Hey, we got. We got something to load. All right, let's see if. See if this one loads. Looks like it. Sick. All right, so this the scan view the list. It kind of looks weird because there's not a lot of columns. We need to add a couple more columns. One that is important is dollar volume. Where art thou? Okay, so I'm going to click this little gear. It should give me an entire list. Toss gives you a. A list of. I believe that you can do one. You can do 19 custom watch list columns in Tus. I don't know why they cap it, but they do. But yeah, here's your. Here's your customs. So we need to get a dollar volume scan up. So I'm going to just name it dollar sign V O L. The aggregation set to one day think script. Boom. Look at that. Magic One day. All right, sweet. Cool. So I got another column over here. Nice. And that's really, really all that I need. Another one that I like that's built in is just 30. 30 day change. So let's add that one. That kind of gives you an idea of who's making the biggest moves in the last month. And toss recently added them, I believe, as defaults. I think it's like percent or pct. There we go. Pct. One month change. All right, cool. Pretty sure that's all I need. Oh, nope. I need another one. I need earnings. So that'll be another custom one. So we'll go down to our custom number two. I need to know how many days away from earnings any stock is. I think this should do it. Why did it not stick? Earnings? Did I hit save? I hope so. Damn. Oh, I just. It's just called custom number two, but I don't see it in the top. Am I just blind? Huh? Oh, there it is. Okay. You know, I'm gonna rename it, and I'm gonna just. Literally, I'm gonna call it just eat. Like, I don't need any other. Any. Like, I'm so about removing. Oh, is TDE native. I'm gonna try that. But the reason I don't like it is because it has three letters. I don't need any more letters than just the letter e. Like, truly for $vol. All I need is the dollar sign. Like, I don't even want to see extra letters. Like, that's how crazy I am about eliminating things that I just do not need. So let's do it. So that's E. Cool. I'm curious about the tde, though. I'm gonna actually just throw it up because I kind of just want to see. I don't got no td. You must have a different version. Okay, so I'm going to change this name in the spirit of eliminating things that we don't need. We're going to do that. Cool. Already organize it. I like to also see company, like business description here. Mainly because this window is so wide. I just. I don't like it. There's, like, so much blank space. So I'm going to add description. Company business description, I believe. Is it you got, like, sub industry, and you got. Maybe I'll add that too. I'll just add, like, sub industry. I like sub industry. There's another one called. I want to say, like, sector, but sub industry is better. Company business description just lists the entire name of the company. Oh, maybe. No, no, no. Company business description is like a whole freaking paragraph. I don't want that one. It's actually hilarious. There's like, phone number, too. Like, you can just grab the. I think what it does, it just scrapes the, like, the first page information of like the, the quarterly and yearly reports and they have like phone number and address. Like you just literally hit them up. Like you can have the phone number in your watch list and be like, hey, what's going on down at Nvidia headquarters today? All right, so I don't want that one. I want. I think it's just description. Yeah, there we go. And I'm sorry in advance for anybody who doesn't use Toss. I don't know why you don't. If you can't for some reason I understand. But I use TC 2000 and I, I gave it a really solid shot. The only thing I like about TC 2000, there's two things that I like about TC 2003 over toss. One is just this. The. The being able to have an overlay of the company name and sector. Like as simple as that is. That is tremendous. I don't know why toss doesn't allow it. Another thing is the leading candle. So like if you're in after hours, the leading candle is shaded a different color, which is awesome. I've tried to do it with scripts and whatnot. It doesn't work in toss. And then the third one is just the alert center. What really sucks about Toss is we get all of our message alerts down here, but you actually cannot click the alert for a ticker and then doesn't teleport you to the chart with the alert. Like it. They have a seriously poor alert system. And then obviously those couple other things. But besides that, it just. I don't know. In my opinion, it just blows. Blows TC 2000 out of the water. And those, those reasons aren't enough for me to switch over. All right, cool. So I'm done with this. So we got our symbols, we have our description. We have our sub description. We have our dollar volume filter by dollar volume. We got APTR filter by that. I probably set it to filter ascending by APTR if it's here. Custom quotes, price, stock fundamentals. Where the hell is it? One thing I'm noticing is we're producing 146 names. That's too many. You know, I'm gonna, I'm gonna actually filter by. One month change descending. So now it should. Should filter by one month change descending. So by this column. Probably going to take like a year for this thing to load though. Yeah, I really wanted to. I have it choked off at 50. I don't know why it produced 150 names. All right, let's make sure it's saved. Okay, so APTR 8. Okay, cool. Yes. Yes. All right, sweet. So we have our focus list. We have our needs more sideways list. We have our daily driver scan. We have er, today, er, today and E, like after hours. And then tomorrow you could combine into one and then just filter by the column. If it's today, earnings will be. It'll. It'll be displayed as a zero because it's zero days. And then if it's tomorrow, it'll be displayed as a negative one. Recently Toss has given more bandwidth to the days out that it calculates earnings. It used to stop at 30. Now it goes. You know, we like this one. I don't even know if they report but like core weave reports in 52 days like six months ago. It would just, it would just say like negative 30. It wouldn't go any further. Cool. All right, so we're still okay showing 50 of 146. So I'm going to bump this up to one hundo. Then I'm going to hit save. And since I have it filtering by percent change one month, it's going to show me the top 100 names that have made the largest percent change in one month. Well, at least it should. I don't know why this one would be here. Oh well, yeah, probably because the rest, the other 46 are actually red on the month, if I had to guess. All right, sweet. We are good. Okie dokies. All right, so earnings after hours today, earnings after hours tomorrow. I'm just going to set up the other two really quickly. So. Okay, so then everything else stays the same except for we need to change. Instead of afters, we need to go to four. So this will be before tomorrow. So I'm going to save it. ERPM. Negative one tomorrow. Okay. ERPM negative one. All right, good. Okay, so then now I will just adjust this to zero, save it again. We should have all four. So this would be today. Sweet. All right, so now I'll get my watch list. Oh, I forgot to save the numbers. Duh. Crap. Okay, erpm today should be 5, 6, then 7. Today we got that one. ERPM tomorrow. I wonder if it's weird if you actually. So there's like two different edits. There's an edit here and then you can hit this drop down and select one. But then you can edit this one or you can edit the actual watch list that's already selected. It's. It's strange though because sometimes you edit the name like this. I hit save, but then it creates another version. Yeah, see it didn't actually change the name of it. It's kind of weird. Like, you think that if you edited the name of the. Of the scan, it would just change the name of scan, but it actually creates another. So I'm gonna have to go in and delete. Yeah. Erpm c. Shed. Okay. Er h. Okay. Yeah. So I have four. So this one should be erpm five. My dog is staring at me and distracting me. It's like he has to go out. Has he gone out yet? Yes. All right, all right, so one, two. All right, cool. Number six. So this should be tomorrow. So I'm gonna change this one, I guess. I think I already did it, but again, so number six. Er. PM tomorrow. Okay. ERPM Tomorrow. Six. Okay, and then we need today. And I'll. I'll swap the two. So erpm. See, I have them all named tomorrow. Let me double check, make sure which one's right. Okay, so this one's pre. Before tomorrow, but this one doesn't have a. All right, cool. It looks like it's zeroed. So that would be today. All right, sweet. Okay, cool. Yeah, so it's saved today. And this should be. This one should actually be six, and the other. Other one should be seven, if I'm following the right order. Cool. So you are 6. Erpm today. And then you will be erpm tomorrow. I just gotta change your name, Your number. Seven. All right, Sweet. Now I'm going to delete the little extra ones that I screwed up so it would be you and then I believe. Okay, today. I think we're pretty close. 1, 2, 3, 4, 4, 5, 6, 7. Do we actually have eight? So there's our daily driver. There's earnings after hours today, earnings after hours tomorrow. Okay, I really don't want to rename these again, but like I said, I'm just gonna go through one. Take it. So you guys can suffer with me. I'm gonna do it right. You can fast forward and people watching this later can fast forward and figure out the. The parts that they like. All right, so we're gonna delete that one. Let me just make sure I'm not screwing all this up. Okay, so we have four. Four. All right, Today, tomorrow. Right, So I need to. I see, I see, I see. Okay, I just have to delete that one. 4. It looks like. Shoot. Huh. Huh. 1, 2, 3, 4, 5, 6, 7. All right, after hours today. After hours tomorrow. Pre market today. Pre market tomorrow. Yes. That was such a struggle. Oh, my God. All right, we're good. I'm just Gonna assume that actually all the scans are correct behind. I'm not gonna go back through and double check them all, mainly because they're just not loading, but let's just say that they are. All right. Sweet. Alrighty. So we, we have our watch lists all set up and in the right order. Now, like, I don't have any other scans. There are no other scans that I'm going to use. What I'm going to do is I'm going to edit the APTR and dollar volume in the scans as my account grows. So I need to make sure that there's adequate liquidity relative to my net liquid in the stocks that I trade. We can't, we can't buy a 10%. We can't place a 10 position and just move a stock. Like if, like, you know, I couldn't, like with my account, I couldn't go buy a 10 position in MBOT. I would probably halt the thing, right? Like, I don't know if anybody's seen Q's famous video where he halted costs. It's hilarious. You should check it out if you haven't. It's great. But like, yeah, I mean, liquidity issues, right? And so you want to make sure that you're scaling your dollar volume settings with your net liquid as it grows. And you can just come up with a very simple multiplication factor. You know, 200 times a 10 position is okay. You could do 500 times a 10 position. As your account gets bigger, that multiplication factor has to come down or else you're just not going to have any, any stocks to trade. And your account, your, your position size will likely get smaller or you'll have to piece yourself in over time. But you're a long way away from that. Like, you won't even begin to think about that until you're at seriously tens of millions of dollars. It doesn't even register as an issue. All right, cool. Well, now let's do the next very tedious thing. We need to adjust the columns in each one of these watch lists. So we need symbol, Mark percent change, dollar volume, aptr and then earnings and htb, etb. Oh, let's do it. Select all remove. Okay, so we have symbol. Now we're going to do mark percent change. And I literally have to go through and do this for all of them. So this is going to be fun. Mark. Mark percent. Oh, come on. Is it percent change? What is going on? Okay, Mark percent change. All right, sweet. You got to use Mark% change to get accurate overnight. Percent change. I know that they've added some newer native watch list column criteria. I haven't gone through them yet. I don't know if the percent change work as well, but I'm just used to mark percent change because I know it works. So I'm using that. All right, the next one is we have our dollar volume so we'll just get our dollar dollar. We got APTR which is natively set to 14. Yep. Okay. We have E. At least I think we have E. We saved it as E, right? Yeah, I thought we just saved it as E, did we not? Oh, it's probably. You think the search would pull up all stocks leading with E and not ones that contain E abcd See, maybe I should have named it longer so I can find it. Strange. Should be the first one. Right. There we go. E. All right, so now we need htb. I use this a lot, especially in the small account. I'm actually pretty, pretty particular with how I layer in positions. You know most people just kind of take positions as, as they trigger. But what I try to do is I try to get in the HTB NTB names into the portfolio first. So then I have essentially full day trading buying power to use intraday for 30ema sort of scalp. If you say you're say you have 100% on of you know your net liquid but then you have like 3.5x daily or day trading buying power behind. If you get it all in and you overnight it, you will have zero buying power the next day which sucks. So it's literally that day trading buying power. And that's what it, that's literally why it exists. So that people can stay fully invested with a longer term account but take short term trades. That's like the purpose of it. So. All right, cool. We got symbol mark percent change dollar volume APTR has earnings hard to borrow. I feel like I'm missing one. Make sure I'm not. Nope, that's it. That's it. All right, sweet. Also HTB ETB. Allows it allows you to understand how easy it is to short too. So you can apply to be a part of the HTB program in TOS and you just send the support chat a message and say that you want to be HTB and you'll be able to short stocks that are htb. But it's not like shorting on any of any of the other brokerages. It's not like shorting on interactive brokers or what are the other ones trade 0 or lightspeed where you can actually like locate and you can see your borrows before you buy them in top. You don't get any of that. Like you don't even know the borrow rate. Actually, I think now there actually is a column where you can see the borrow rate, but it's like you short it and you're disagreeing to whatever it is. That's just kind of how it works. God, I really don't want to have to do this five, seven times, eight times. But you know, you can always fast forward. All right, let's see how fast we can do it. All right. Customize move. All right. Dollar volume mark, percent change. You know, I'm going to actually rename this one really quick. Abcd. Come on. I'm gonna pass it. All right. Htv. What was the other one? The other one was dollar value markers on change. HTB and then it was aptr. Okay. PTR earnings represent change goes number two. Sweet. All right, I'm going to change this one just to earnings for now. Just so I can find it faster and then we'll, we'll go back. All right. Earning. Yeah, this is also kind of another drag. It's like a drunken. I don't know, it's a major. I don't kind of. It's a shitty. It's a shitty part of the TOS user interface and experience that you just can't copy settings from one watch list to another. Like it's, it's just kind of, it's kind of silly. It's such a simple thing but. Whoops. Huh. Strange. What the hell? To continue logging out. Cancel one. Okay. Earnings. All right, sweet. Yeah, this is definitely going to be a two parter because I feel like we've already been recording for like a half hour and I haven't even gotten started yet. All right. Aptr. What am I forgetting? Yeah, you should be able to like save these as a group and I don't know, just a one click sort of deal. But earnings HTTP are sweet. All right. 3. Oh, there's actually another watch list that I forgot to add. Huh. This one's easy though. It just has a slightly different. We got all those requirements. It is your actual active. Active positions. I believe it's called. Dollar volume aptr. Two more. Oh God, I'm never doing this again. Never. It. Last one. Last but definitely least. The last one is hd. Okay. All righty. God, what a marathon. All right, so we need to add that other watch list and it's going to be just watch list, zero watch list. Personal I think it's public. No. Where is it? Current positions? All right, sweet. So you can see my father in law's positions? Yes. No. All right, Sweet. All right. So like all these columns aren't lined up. I cannot allow that. So I take the symbol column. I go all the way over basically to the point where it doesn't cut off the, the symbol abbreviation or the stock abbreviation. Okay. You get all these lined up so it satisfies our soul. If it doesn't bother you that they're not lined up, something's wrong with you. I don't think there's any successful trader out there who doesn't have these lined up. I think it's kind of like a prerequisite. It's one of those hidden things that no, nobody talks about. But yeah, it's pretty important. Sucks. I don't have this symbol, you know, I'll just add a symbol. Tesla. So the watchless columns for the current account are a little bit different. We need to see our net liquid. I need to see. I need to see net liquid. Because I don't. There's instances where I want to trim based on ballooning. If, if the position has ballooned to, you know, maybe like 20 of my account or something. You know, that could be kind of a trim scenario. And you can set that up, you know, within your system itself and the definitions of your system and, and how you're going to take profit. But yeah, let's set that one up. Alrighty. Okay, cool. So it looks like we're. We're good. So symbol mark. Percent change. Dollar volume. Aptr. Earnings. Hard about. All right. I'm closing all the books. All right, so now we're gonna set up our current account. So I need to see net liquid. This account started with, I want to say 45 grand or something. Not a lot of money. So there's net liquid. Then I need to see mark. Percent change. Okay, Cool. Lined up. All right. Net liquid. I want to see pl percent. So what percent. I'm just gonna get all these in there. Oh, darn. Another one that's really important to keep in your account window is aptr. It's a really good kind of check and balance on yourself because average. Average APTR is, is really important for your account if you care about optimization and account growth like I do. Like you, like dead ass need to be very cognizant of your average aptr. Now let's just assume that all these have the same net liquid. Somebody could calculate the weight if they want. It looks like you know, 4, 4, 9. I don't know, it's probably like APTR. Probably of like, I don't know, 6. Actually. Let's just do it real quick. What's that? So that's 4, 3.88 and then 966. So that's 5.8. That's too slow, way too slow for this count. The reason why I'm in these names though is because I can't babysit it all the time. So I just need to put money into stocks that I don't have to look at hopefully for like months. So he just has stops set and if they hit, they hit. But like I'm planning on these stocks moving for the next year. If I was, if when I have more time to actively manage it, I'm increasing that aptr. Like I would not be in crowd. I would not be in dash hims. Absolutely. I should be in him him X for sure. But yeah, anyways, I'm not really giving it a ton of, ton of attention. Okay, so aptr, Net Liquid, PL day, peel open, peel percent peel year. I don't really care about my average here, but we can, we can put it mainly because you'll see the average come up in the active trader window. And one of the reasons I don't like it is because look how many characters they used. Average trade price. It just takes up so much space it looks sloppy. That's like literally my reason. Because then you start just getting a little too wide. Like, I don't need some of these things. It's nice to see them. But Net Liquid is not negotiable. APTR is not negotiable. You don't need PL year. Like you don't really need this. You can see it elsewhere. And it's not like that. Like it's not going to help you with making trade decisions knowing what your PL year is. Right. Like it literally provides you no benefit whatsoever other than, I guess, feeling good about yourself, which is fine. I mean, I don't think that's necessarily bad. You know, if you have, you know, given yourself a pat on the back in your system, that's great and there's sound reason for it. I'm all about it. But these two are most important. APTR and Net liquid. All right, so we got that set up. I'm not going to do that yet. Does anybody have any questions? I mean, I just, like I said, I'm just going to keep barreling through this until it's set up and I can actually trade on it but if anybody has any questions about the left nav, watch the setup. Holler. But yeah, I mean it's pretty, pretty straightforward. So I need to set up my account info as well. There are some things in here that, that I like to see. One, and this is especially when I'm using day trading buying power, which is really. I'm not really going to use it in this account much, but I'm going to remove as much as I can. A lot of them are stock. All right. So it allowed me to remove everything. Cool. All right, so we need, we need net liquid for sure. One, we need percent. I need equity. Percent. If you're under, if you're under pdt, then you need number of day trades. But I'm not going to put that here. I like seeing PL day. I like seeing PL percent. PL year is good. PL open. Okay, I feel like I'm forgetting one, but all right, so we have net liquid equity percentage. Oh, available for trading is another one that we need available for trading. I really don't care about revealing the balances in the account. I just don't want to show his full account number. It would make it easier to see for you guys if you could see the balance cash available for trading. No, I don't think that's the right one. It's available funds for trading, day trading buying power. Okay. Another one that I like to just keep an eye on are the fees in my account. I trade futures at times. So you have these three. So I'm going to put those up there. So you have like equity fees if you're on margin. And then I think also borrow fees are here. And then you. Obviously there's, there's future contract fees and then there's a combined total. But this account really won't have, have much need for those. But this is what my account info panel looks like. In my account. HTB just means that it's hard to borrow. It means that there's not enough. There's not as many shares available to borrow on margin compared to other stocks that aren't hard to borrow. So it's a ratio thing to scarcity thing. And so stocks that are hard to borrow have higher fees to borrow them. And the fees are based on supply and demand essentially. So like stocks that go like 2000% in a day that are just like, you know, super easy shorts, like they could have insane overnight borrow fees. So that's one thing. Another is htbs you in. Toss on Charles Schwab. You can't. You can't you don't get the same day trading buying power multiplication factor on HTVs as you do ETVs. So like for example Tesla has I think for most margin accounts and if, if it's not a portfolio margin account that you can get 6.5x 6.5 to 7x on typical margin accounts I believe it's 3.75x. So if you're, let's just say for round number purposes if your account value is 100,000 you could buy 375,000 worth of Tesla if it's ETB, but of TSLL you can't because it's HTB and it's leveraged and there's. Let's see, we can find it but there's a couple of different ways and this might, I'm. This would be like in like very advanced I guess toss but you can look at, there's a couple of different values you can look at and essentially toss bases its margin multiple on the volatility of the stock and that's what can make a stock NTB not to borrow as well. And it's just, it comes down to risk and then it comes down to just scarcity of the shares that are available to borrow at the end of the day. I don't know if that answers your question, but HTV means hard to borrow, ETV means easy to borrow, NTB means not to borrow. And you can look up, you know the specifics for each and how a stock may be designated those criteria. But again though the calculations change based on the stock's volatility and the in the supply and demand of the borrow. All right, sweet. So we got our left nav set up. Now we have our seven watch lists or we have, excuse me, we have five scans and we have two manual watch lists and then we have our current account. So there's current account focus list will be for only actionable names, names that we can actually execute tomorrow. Needs more sideways lists are, there's names that we can execute tomorrow but most likely they need more sideways. We're watching them, they're like next up. So like focus list would be like grade A, you know, five star setups, you know, high four star setups. Whatever needs more sideways is like fours, threes, things that you're watching or names that have already taken off that have made huge moves recently and you're just watching them, waiting for them to flag and moving averages to catch up. Etc. This one's our daily driver number three. It contains our opportunity set other than our earnings, our earning scans. So I basically trade continuation setups, you know, big base breakouts. And then the other setups that you guys know about, those would be like my routine kind of setups. And then the other four are just for like, eps. So stocks that have big reactions to earnings reports, I'm watching and paying very close attention to using these, these scans. So in like, earnings season, let's see if any are actually reporting on tomorrow after hours. Yeah, so here's a bunch that are reporting tomorrow. So. So this would be Monday after hours. So I would filter it by like dollar volume. When I'm actually watching, watching, like, them live, you know, after hours, I filter by mark percent change. Because if a stock is really making a big move to like an earnings reaction, it's going to come to the top of the list. And then if it's, you know, has like a negative earnings reaction, it's going to go straight to the bottom list. So that's how I kind of filter them. So I'll. I'll actually flip back and forth through dollar volume because I'll want to watch, like, app. Like, I want to watch the largest, highest, like the most liquid names, but then also I want to see which ones are advancing or declining. So I'm like kind of. I flip back and forth. And the more I look at it throughout the day, the more I'm aware of what's reporting, who's reporting, etc. All right, sweet. So that's the left nav setup. Let's check it off our list. It's tedious work, but it's done now. I don't ever have to do it again. I don't have to do it again. So it's great. Well, I have to do it again if I set up another platform. And I think that I can actually export the workspace. I don't know if. I don't know if it'll exactly mirror because I don't think an export of the workspace passes along the custom scans or the custom watchless columns, but whatever. All right, let's go. Activity positions. All right, watch. This is done. So we. Let's go to. Let's start setting up some shirts. Some shirts, eh? All right, so we're gonna go to charts. We're gonna go to Flex grid. I only want two charts at any given time, side by side. Cool. I'm gonna close you for now, actually. I'm going to open you back up. So there's this little link button. I choose number two just because it has More contrast than the red. And then you need to make sure that all of your watch lists, all eight of them, are also number twos so that when you click a name, it links if it's set to like three blue, which is the worst color ever. Can't even see it. It doesn't link to the blue one. Right. So change to change the two. Yeah, there's his stop for crowd down here. All right, so we're gonna get Sidebar, Sidebar, sidebar. All right, so I need to set up two different workspaces. One, I need to set up the scanning workspace, and then I need to set up the execution workspace. I think I'm gonna set up the scanning workspace first. Okay, so let's make sure that these are split. All right, we're gonna hide the sidebar. Cool. All right, so scanning workspace. We need news. So I'm gonna put the news on the right side auto arrange, and then I'm gonna drag the news down as small as it'll go. Okay, we're gonna save this workspace as one scanning. Dots are not allowed name. All right, One. Scanning. Cool. Okay, so the left screen. The left screen will be the daily, and the right screen will be our weekly chart. All right, so first we need to enable some settings. I need to get my tools up here. So we click the little settings, we go to my tools on each chart, and that pops up this little bar, which is awesome. And then I'm going to click the pin, and I'm going to make sure that it doesn't genie effect on us. All right, so the first chart that we need to set up is the daily. Okay, so I don't like these background. I don't like the background color. I don't like the rollover lines. I have no use for them whatsoever. I don't like the hollow candles either. So I'm gonna opt for solid candles, just a flat back black background. And then I want my candles to match the volume bars as well. So let's get that all set up. So we're gonna go to equity or appearance. We're gonna fill up. Cool. And then we're gonna go background volume bar, same color as ticks. Cool. And then grid. I don't want no grid. Cool. I think I got everything. Oh, background color. Let's make it black. Perfect. Okay, so rollover line. So I think that's vertical axis, which is price. So I don't want to enable the left axis. And then I think they're called, like rollover lines. Or something. They might be in the general. I don't want high, low bubbles. I don't care about last price. I. I need show orders on positions. Do not show. I think I forget what that does. We're gonna leave that on show alerts. Yes. Show studies. Yes. Yes. Snap drawings. No care about you either. I don't know where these damn rollover lines are, but we will find them. Price access. Okay, so for daily charts, I like 20% up and 5% down. No, 20 is too much. I need 15. So, like, I see a lot of people. They have their charts set to, like, 0 and 0. And so, like, the leading candle is hugging the right price axis. I can't do that. I need space so that I can imagine how the candles progress over time. If it just abruptly ends into the. Into the vertical price axis, it doesn't allow me to imagine much because then I'm kind of distracted by the numbers. And then, like this side menu, etc. Like, I want like 10 to 15 bars of space from the right side. And then also I want some margin. I don't want to distort the charts. So some people. Some people set their charts like this. Okay. Like, that looks tight, right? Like, it smushes it together, smushes it down. It. It distorts it. It provides. It provides like, I don't know, like an unrealistic view of the contraction of the volatility. So 15 and 5 I found to be pretty good because 5 just. It places the lower candles right off the bottom of the chart. If you go zero sometimes if you go zero and you have corporate events on which are these little bubbles, the corporate event will overlap the candle, and it's just kind of a sloppy look. So five just gets it right above it. And 15 presses down just a little bit because I want to be able to imagine this upward trajectory. If you again, go like 50. Wait, how high can I go? 30 is the highest. It really smushes things down, and it just. It's just not right. But if we go 15, 15's kind of the sweet spot. Okay, so time axis. All right, Expansion. I'm gonna give myself 15. This is the bars to the right. All right, Perfect. Aggregation. Time interval. Day auto. Expand to fit studies to show rollover lines. Don't want that. Don't want that. I like the year end marking lines. I think that those are important. This is this gray line, but the rollover lines, you know. All right, sweet. We're looking pretty clean now. So this is essentially a naked chart, but now we need to set up the. The actual indicators that I use on the daily chart, which are the moving averages. So they're the simple moving averages. Those are the most important. So we will set them up. So edit studies. So price. Let's see. So SMA simple moving average. All right, default set to nine. We're going to change it to 10. Make sure see how that looks. All right, cool. Teal, I use 10. I use teal for 10. I use the same colors as Koala Mega uses because I obviously watch a lot of streams a zillion times. So I just emulated those same colors because it really helped me when I was watching his streams to have the exact same colors on my charts and just kind of made sense. So let's do the next one. So we're gonna do 10, 20, 50, 100 and 200. So 10, 20. Oh, I also need the five. I use the five a lot. Q didn't really use the five. My 20 is like maroon, which is the same as his. Let's add a five. I use pink for five, Five, 10. Come on. Five, 10, 20. We need 50. I use orange for. Then I need a hundred. 100 is white. And then my 200 is green. Okay, so I'm going to set. I'm going to save my study set aside one sma. Cool. Okay, so now we are going to save this style as the letter D. And then I'm going to include the patterns in the study set. This will, this will include all the indicators. So I'm going to go up to my, my tools. I'm going to change text note to that study set or I'm sorry, to the style. I'm going to change like trend line. The name. I don't like the long name. So I just put a dash in. And then I'm going to change this study set just smas. Cool. Nice. While I'm at it, I'm just going to add the horizontal line drawing tool price level. Okay. I'm going to get rid of that long name because it takes up too much space. They have like these little icons so you don't really need the name. So you have like this slash for a line. Then you have the horizontal. But then you can also, if you're on a mouse, you can just click your mouse wheel and then it provides the tool set right here. Right. Right where you need it. Alrighty. So this time frame is set to I want to say last 12 months. I want more time. So we're gonna go to settings, probably time axis, Year I'm gonna go three years one day. Cool. Gives me a little bit more. More chart history. And now I'm going to save it. Every time you make a change, you got to save it or else you're going to lose it. All right, save style include. All right, sweet. So those are the majority of the indicators. We have a couple more to set up. We have MACD and then we have some chart labels. So we're going to go back into studies. We're going to go to Mac E. Put it in the lower. Cool. Does it automatically. It comes default 12, 26, 9. So we are going to set it as 6, 20. And then I don't want up signals that actually I do. Let me see how this looks. All right, that's cool. All right, give me arrows signal. I forget where this is actually done because it, it shows that they're selected but they're not actually showing on the macd. I wonder if it's a different. Is it a different study show breakout signals above. Oh, I see it. All right. So good eye. Thank you. Haha. Voila. Okay, cool. So we got macd chart label. I just like seeing APTR and then I like seeing the dollar volume stuff below. All right, we're to save the. All right, sweet. But this chart's looking great. I mean it's super clean. We don't have anything unnecessary. We use every single. Every single, I guess action visible that we can control. We've eliminated everything that we. That has no use for us. Do you think the MACD green red bars in the back are necessary? I like you, I like seeing them for sure, but I don't. They're probably not necessary. It's not like it's. It's not like I require them for entry. So I mean, if that is. If that's how we evaluate whether or not something should be included in our setup, then they probably shouldn't be there. I would say that you're right. But yeah, I'm just not gonna eliminate them right this moment. Okay, let me see what I might be forgetting. All right. Studies. I know at the beginning I said I was gonna build every script from scratch, but that just seems like such a pain in the ass. I'm not gonna do it right now. I need just my chart label. APTR chart label. I'm gonna grab that. All right, Studies edit. We need to create Think script. There it is. So like, if you're watching this later or whatever, you can just screenshot this image, paste it in the chatbots and just ask it. To transpose it or transcribe it, copy it or whatever and you'll, you'll get it. Okay, so we're going to name this one APTR Chart label. Sweet. Okay, cool. So I have. I don't make no sense. Why is it reading 88%? Why is it reading 88%? Huh? It must be a problem. There must be a problem. Just tosses data. Yeah, my 99. Oh, oh. APTR4.88% is, is how much of a single APTR price has moved in the last day. So price has. The volatility in the last day is 88% of for APTR. So it's kind of like if you're over a hundred percent, it's kind of like you're chasing a little bit. So it's kind of like a, like you want to try to enter your stocks when that percentage is lower than 50. Ideally. But under, under one's fine. But the closer you get to one, the more you're. You're getting into chasing territory. Like if it's 200, that means that the stock's up 2x its average APTR and you're like definitely chasing at that point. There's all sorts of different techniques for how to take advantage of stocks that have moved up a lot. Not going to get into that right now, but. All right, sweet. We got that. All right, so then I need my volume studies. So the volume studies will show me what percentage the volume today is relative to an average number of past days. And then there's a 20 day average. I have a daily average. And then I have. Yeah, just a daily average and a 20 day average. Here's the 5. 5 day average. It's weird. Like you can't name a study that begins with a zero or you can't name a script that begins with a number. I'm sorry. So you can actually spell it out. So five day dollar average. Very cool. Chart label. I should probably actually start with chart level. Sweet. And it didn't calculate. Oh, I see. Because it needs to go in the volume section. Yeah, you have these different sections. You have price, which is the chart. Then you have volume, which is the volume histogram. And then you have the lower, which is where the MACD goes. And then now you see, I have this little percent of five day average. So CrowdStrike. Yesterday CrowdStrike's volume was 118.4% of the five day average. Okay, so then I'm gonna get the 20 day average up here. We get the one day and the 20. Yep. So day colon. So I traded $2.1 billion yesterday roughly. So that's one day. And then we'll get the 20 back and then we should be good here. All right, sweet. Save my set and then I'm going to save the style again because it's, it's tied to both SMAs and this daily aggregation, this daily chart. And there's, there's different. There's a reason. It may seem redundant right now, but sometimes I like to look at SMAs on like a 12 hour chart as opposed to EMAs. But my 12 hour chart may be saved default with EMAs. But sometimes I like to look at at both of them just for kind of different perspective. It really depends on certain things. It depends on recent volatility and whatnot. The less, the more recent, the more extreme volatility is in the near term, the more inclined I am to use EMAs just because of how they're weighted. So more recent data points have carry heavier weight with exponential moving averages. Simple moving averages are just a straight, straight average. Right. You just sum all of the points and then you divide by the number of points. But like I said, EMAs have more weighting towards data points that were collected more recently. All right, so. All right. Save the style day. All right, sweet. I think we're looking pretty good. I think we're looking pretty good. I mean, that's really it. I mean I, I could, I could seriously just trade off the daily chart. Like you really do not need another chart. If I just had the daily and the five, I'm fine. I'm totally fine. Like I would do. I'm sure I probably even, I probably do better with just the daily and the five than having access to other time frames. I do like seeing time frame like synergy or like time frame confluence. You know, like the best situation ever is when you have a five star setup on the five minute, the 15, the 30, the hourly, the four hour, the 12 hour, the 24, the daily, the weekly all simultaneously. Like that is the best. Where you could literally flip through all the charts and every single one of them are set up. That's like, you know, free money sort of set up confluence on all time frames. And really if you look, if you kind of look at all the, the really great movers out of solid technical patterns, they kind of all have it. And that's why you'll see my toolbar have pretty much all of the time frame. So when I'm done setting this up, it'll have daily, weekly, hourly, well, let's just go in order. It'll have 5 minute, 30 minute, 1 hour, 4 hour, 12 hour, 24 hour with extended daily, weekly and monthly. I have literally all of them. And as you, you know, if you've seen my other videos and watched me scan, I am flipping through them and I'm just looking for left side peaks, larger ranges, you know, because if you're trading a five minute chart, you're really just trading in a 30 minute range. If you're trading a 30 minute chart, you're really just Trading at a four hour range. If you're trading a four hour, you're really just trading in a daily and all the way up to a weekly. And if you're trading a weekly, you're actually just trading in a monthly range. Right. So you know like having a beautiful setup on the monthly is the best, right? Because you know that the ultimate high range, the largest time frame range that you really give a shit about looks great. Right? So if you kind of work, work your way from highest to lowest, that's, that's a really great way of doing it. I think most new traders start on the lower time frame and they work from the lowest all the way up. Well, actually most of them just stay on the lowest and they don't really have any perspective of the higher time frames. They really, really don't care about them. But that's not us. All right, so we're setting up our scan grid with a left side daily chart and then we're going to do the right side is a weekly chart. Okay. So if I click this day, it should just emulate it. Huh? It didn't say. But if I click smas, boom, there we go. And I hide the news for now. Okay, so now we're going to change the time frame to weekly. So there she goes. That's three years week on the right screen and then three years daily on the left screen. Perfect. So now I'm going to just simply save it. I'm going to save the style as a W. I'm going to include pattern. Now I'm going to add it to my tools. Add button style W. Cool. So now we have a W. So if I just want to see my weekly on the left side, we can do that. We can flip them. But I read from left to right and typically things are sorted in ascending order. So I think it makes sense to have the daily time frame on the left and then the weekly time frame on the right. So news is important, especially when we're, we're looking at like earnings and whatnot. I like having synergy. I like having good like what I call like platform feng shui. If I were to add this live news here, it kind of throws off like the other histograms. They're not lined up anymore. It's an odd feeling. But in Toss, we have the ability to add news in our sidebar. So we're going to add live news and I'm actually going to move it above message center and then I'm going to make sure that it is linked to my chart with a 2. Lots of times I just keep it closed. But if I see a stock like really ripping kind of out of the blue or something happening, you can just pan over and open it up and take a look and see what's going on. And then you can set like alerts and you know, like there's keywords and there's all sorts of cool things that you can do in this news widget that you can't do that you can't do in this news widget. Okie doke. All right, so. So you can right click and we will auto arrange that lines them all up. Nice. I don't like the volume this high, so kind of bring it down a little bit. I want some more chart. I want an aspect ratio of like one to one, as close to one to one as possible. I see people have aspect ratios that are like three to one or whatever. Like this isn't terrible. This is probably one, probably like two and a half to one. But you start getting into like, you know, people doing stuff like this, which just compresses your chart and it, it gives you an artificial sense of tightness. Other people like go the other way with it where it's like this, like I said. See, people literally trade like, like this and it just makes it so steep. I don't get it. It's. What you want is a one to one. And the reason for that I think is most brokerage platforms come with a one to one standard or like two to one, I think is as far as you can go. If you look at like the charts that, you know, I guess like larger institutional TAs use, they're like those larger white background charts and they're, they all bear the same aspect ratio. They're looking at the same candlesticks with the same proportions right. Of negative space. And you probably want to be looking through the same lens that the whales, the whale tas are. There's not many out there who have like super smush charts. Or like, really, like, over exaggerated aspect ratios. So it's. It's. In my opinion, it's really important to just try to keep them as close to just what would be considered normal as possible. And a one to one is, like, very normal. One to one is really normal. Or like, even like a two to one. Two to one. Width to height. Yeah, I guess that would be like width. Yeah. To height. Okay. Auto range. Let's bring you down some. Bring you down. Okay, perfect. Now I'm gonna. You have to save them again, or else the. The height of the volume profile will not. Will not stay the same. So we're going to save it as day, then we're going to save you as week. Perfect. All right, so now it should, like, if I screw this up like that, if I click weak, it should go back. All right, perfect. Let's screw this one up. Click day. No, I must have not hit save little checkbox. You got to hit that little checkbox. Okay, so save style little checkbox. All right, let's jack it up. All right. Voila. All right. Sweet. We're cool. Whoo, man, what a marathon. All right, now I'm going to save the setup. I'm going to save the workspace as scanning. Cool. What we don't need are these sidebars. Actually, they just take up space. You don't need those. So customize, unclick, check sidebar. That gives us just that little bit of extra space, but it's kind of important. Oh, I didn't really preface this, but we're building a single screen layout. Like, we do not use another screen. You don't need it. You don't have to have 10 charts up at all. If you're. If you're trading, if you're executing on the basis of a trigger based, you know, swing trading strategy, you. You do not need to know what every chart in the world's doing. Like, you don't. You don't have to know. Like, they don't really impact what. What we're doing. We're picking leaders. We're stock pickers. We're not macro economists. It doesn't matter at all if you look at any of Q streams. He said it a thousand times, but if he didn't say it enough for you, I'm saying it again. It doesn't matter literally at all. And if it does, please state your argument. All right, I'm going to save. Now we're going to save the whole workspace. Yep, there it is. Okay. We're going to save workspace as scanning. All right, perfect. Cool. So so far we've set up our watch lists, we set up our kind of our left panel so we have our account info with all of the, the data points there that are, that are pertinent to have a kind of a high level overview of how well your portfolio is doing, how well you're doing on a day, what your exposure is like current account, it's essentially the same as account info just on a per stock basis. Our focus list is our executable trigger list for the day or needs more sideways list as like you know, basically our b, our B stocks. Ones that may not be like you know, blatantly obvious triggers but they still could be anyways needing more sideways. Then we have our daily driver scan and then we have our earning scans. Then we have our news and we have our message center. I will set up the execution grid and then I'm gonna probably call it. There's still a ton left to do and I'll do that in a part two. But if anybody has any questions as to how to set any of any of the reasoning or whatnot, holler not. I'm just gonna keep going. All right, let's keep going. Okay. So for execution. So we don't need the weekly chart for execution. It's really just a matter of do you want to put your 5 minute chart, your intraday time frame chart on the left or the right? I like having my execution chart closer to my list of stocks. So it kind of follows the same hierarchy from left to right in ascending order time frame. So we're going to push our daily over here and then now we're going to convert this one into, into our five minute. So we will for me, the way that I trade, I will have the active trader window up and I will have time and sales which will add some width to this pane. So I'm going to slide it over and we're going to compress the daily chart a little bit and I may not need to do it this much. We'll see when I get these other windows up. But we'll definitely have to do it some. So we're going to add the sidebar. We are going to add active trader and time and sales. Okay. Time and sales, you can press all the way over pretty much. Okay. Active trader. All right. Volume is overlapping. So we need to get volume. I don't like, personally I don't like it when the volume overlaps and sits on the chart. I like it like as it broken out in A separate, like, histogram. So that is in settings. Where is it? It is overlap volume. Okay. No overlap. All right. Sweet. Auto range. Nice. So we can push you over. You can move, you can compress. You can narrow the margin of this left panel all the way to the point where you're not compressing any values. If you push it too far and you start compressing values, you've gone too far. You need to be able to see the full ticker and then the full readout of all these other values. And it may take some, like, adjusting of the column width, but it seems pretty good here. Okay, so, okay, so this looks to be set by default. 5. 5. I like it. 5. 3, maybe. I like it. 5. 2. Let's check it out. So price access time X is five, five days. Let's do three days Apply. Yeah, that's. That's better. And then we need to make sure that highlight extended hours is on. And we're showing extended extended hours. Perfect. All right. Okay. So we can compress the active trader window over quite a bit. Okay. Now I'm going to bring the volume down so that it lines up with the daily over there, and we can probably even give ourselves just a little more room. Cool. So new traders, I like. I like them having the daily up. Once you get familiar with the intraday SMAs, the intraday daily SMAs that give you visibility of where the daily SMAs are on an intraday chart. Once you get comfortable with that, you actually don't really need the daily chart anymore because those intraday lines give you enough perspective. But yeah. All right, so we don't need to see the sidebar anymore. Hide it. Okay, cool. There we go. So a little trick. If you double click the blue bar, it expands all the way so you get the full chart and you can double click back. Now what we're going to do is we're going to save this style with the title, you guessed it, five. And then we're going to add it to our tools style 5. And then we are going to sort it in ascending order from left to right. Perfect. So, like, if it's, you know, the middle of the day or whatever, and I just want to see the daily, I just click the day like, I just click the day like, you don't actually need both side by side. Like, I'm always kind of looking at all of them, just kind of zooming in, zooming out, zooming in, zooming out. But what we need to do is we need to change all of these SMAs to EMAs. And this kind of follows up on what I was talking about earlier where I want to this. The lower you get on the. On the chart time frame, like 5 minutes is lower than 10, 10 is lower than 30, etc. The more inclined I am to use EMAs just due to how they're weighted. So we're gonna switch all these up for EMAs. Fun, fun. So let's do it. I did notice that there's a comma. One, comma. Smas. I don't really like that. I'm going to change that as well. So edit studies, save set. We're going to go1.smas, and then I'll delete the other one. So I don't need any of these simple moving averages anymore. So now we're going to do exponential moving averages. So there's one. How many do we need? We need 5, 10, 20, 50, 100. You know, I don't need the hundred. I don't need. I'll keep the 200. So it'll be 5, 10, 20, 50, 200. Okay, so that's five of them. And then we're going to color them the same color as our. As our daily SMAs. So this will be a 5 pink. This will be the 10 default teal, the 20 maroon. Okay, 50 orange. Let's get the 100. We're going to go straight to the 2, 2 hundo green. All right, that's all good. 620. Perfect. Okay, so now I'm going to add the intraday SMAs. So that would be daily SMA. So we're going to have the again the 5, the 10. I'm going to put the 100 on. So we're going to 5, 10, 20, 50, 100, 200. So 1, 2, 3, 4, 5, 6, I think. All right, so 5. We're gonna go pink. So it gives you the option to show only the last period. I say yes. It doesn't help. Great. When you want to do intraday chart, like historical review. You actually want no. So that you can see where the EMA was intraday and past sessions. Like you want to go back 15 sessions. You kind of want to set it to no, but you could just save a My tool that has it for both setups where you have a yes and a no version. But for my purposes here, I'm just going to set them all as show only last period. Okay, so we're going to 10. Show only last period. Yes, 20. Change it to maroon. Show only last period. Yes. 50 orange. Show only last period, yes. 100. Period. Yes. White. Okay. Now 200. Okay. So you see how it's smushed everything? That's because it has like, fit study sets. Fit study. There you go. Cool. So we have to uncheck that. All right, sweet. So now we have all of our daily moving averages plotted on the intraday chart. I just compress this so that you can see it. But you know, crowd, it's 200 is 352. So it's way down here. You know, this is really important because they are key levels. As you know, many of the setups that I trade, we're buying as price is moving through these key levels or bouncing off of it with a wash out long or whatever. So they're really important for me. I also want to see them all over. I want to see them lined up in the proper hierarchy. So the 5 above the 10, the 10 above the 20, etc. So you want to see them essentially sorted on your chart in ascending order. That's the best. Seeing all the moving averages stacked. And here in crowd, they're stacked perfectly. They're a little far from one another. Let's see if we can find a stock where they're not very far. Looks like a super tight. Maybe hymns Hims may not be that far. Yeah, these are tighter. I feel like that one was tight. Nah, there's probably be like a real slow name like meta. These are tight. So the 5 and 10 are really tight. But you'll come across stocks where like, it's the 5 to 10, the 20. They're all within like a half APTR of one another. And that's like. That's great. You know, we like that. I think RR is actually like that right now. Yep. Look how tight they are. There's so many moving averages, and they're all within one aptr of one another. But what I don't like is the 100 is above the 20. Really? This 20 needs to get above the hundred, the 50 needs to get above the hundred. And it's kind of like indicative of the stock needs more sideways. So once they're all lined up in ascending order, it's a really good show that, like, the stock's kind of ready to go. But if they're still, you know, kind of out of whack from a hierarchy perspective, you can, you know, reasonably say that that it needs more sideways. All right, so we are gonna save this style. Save style five, include Sweet. Now I'm going to actually save this Study set as 2emas intraday so this is our intraday EMA setup and then we're going to add that button study set EMAs going to move it up. I'm going to see if I can change the name, make them shorter. So this is just going to be SMAs and then you are going to be EMA's intraday. Yeah, EMA's intraday. And the reason why I'm adding the intraday suffix is because of the daily SMAs on the chart. So this is a study set and style that is pretty much geared only towards intraday price action. If you check that box for the Daily SMAs, you can actually kind of reduce and you could check all of these as no. To show you what it looks like. See how it kind of like. I'll zoom out. Let's flip it to the EMAs now. Let's just, let's set this one to no. So you can see it but like it. You see how it's kind of like a stair step. So that's like the average of the day. So the 200 SMA yesterday was this level on average throughout the day. So you could actually, you know, if you're okay with like the stutter steppy look, you could actually just get rid of one of these configurations and reduce that further. I just don't like it. That's weird. Alright, so I need to. I'm going to compress this a little bit just so it's more fluid or so it's more even with the other study set. So I'm going to save stuff. It's weird. The volume height is that it's controlled by. By studies, not by settings. It's kind of strange. All right, close enough. All right, so we got five, got a day. We got our weekly. So for the weekly I don't need 15 bars to the right. It adds too much space. 15 daily bars is nice, but for the weekly I think it's like, I think seven weeks or maybe four weeks is ideal. And these are all personal preference things. What I like to see is I like to see just good platform feng shui where all of the components and the sizing, the length, the width, the height of all the various attributes and I guess data, data feeds, all the windows, all the panes within the platform, they're all just sized in a way that makes sense. It's kind of like, you know, laying out furniture for, for your house or something. Right. Like you're. You just want to put things in places that make sense. Think about how you would organize the drawers in Your kitchen, you know, where, where your plates go for different occasions, etc, It's. It's like this. Nobody wants a junk drawer either. Like, there's no junk drawers. We can't have a junk drawer. We need to keep our brokerage platform as clean and as efficient as possible. And for me, it's just a mental thing. If I had one chart style set, up, like, with different colored bars or different heights or widths or whatever, it's just gonna throw me off. And even if I were to like, lie to myself and say like, oh yeah, it's just, you know, actually the differentiation of the colors is like, better. Like I'm telling you. It's not telling you. It's not. If it truly is for you, great. By all means, you can have all sorts of goofy layouts. But what I, what I seriously recommend is everybody go through their brokerage. Even if you're your platform, even if you're not using Toss, just make sure that all the elements, all the information sources are feeding you information that is that you actually use. And make sure that the sizing and spacing of everything, you allocate space on your single screen in order of importance. So if the chart isn't that important to you, but you use the tape, make the chart tiny, you don't need to see it. Right. It's just kind of like common sense things. But I, I feel like a lot of people just don't think. Think about it too much. All righty. So we're pretty, pretty good. You know, so we have our extra chart over here if we really want to see it. But when you have all these various time frames set up. And again, you know, you need to set up the hourly. I like the 12 hour. I like the 24 hour. Like Monday, pre market. 24 hours. Great. Pre market, 24 hours. Always great. Having all those various time frames set up and configured to your My tools bar is important because then you can just flip through them. So we're gonna save this grid. Oh, crap. I have one more thing to do. We need to set up the active trader window. I can do that real quick. And then, and then we'll be done. So we need to set up. We have buy market, Sell market. I also need. I don't need reverse. You don't want to accidentally click reverse. I don't need cancel. But we do need Cancel all. Cancel all. Okay. Add items or Buy market. Sell market. Okay, we need Buy bid. Sell bid or Buy ask. And then we need Buy bid. Okay. Then we slide it up next to the other buy here we have flattened. Let's see how we're looking. All right, so I need sell. Ask salted. Okay. We're looking better. All right, so now we need to get them in order. So we're going to do buy market and then we're going to do buy ask and then buy bid. So buy market, buy ask, buy bid, sell market, sell, ask, sell bid. So now we're in order. We're going to add cancel all above the fold. Cancel all above. Sweet. Now we need to add tiff. This allows you to execute in different market sessions pre market after hours. See how our balance is looking. I'm going to put tiff above the fold there too if I can. Tiff, you go right here. Sweet. All right, cool. So extended day. Okay. Auto send on template single. All right, that's pretty much it. So we have our buy sell position. I mean average pl open PL day. What is pos flat? I don't think we need that one. We need. So I want to see average to get rid of all these. I want to see my average. I want to know my position size. It's the number of shares. I want to know my profit and loss day and my profit loss over open. Okay. Why is it not true? Okay, so all right. Average price, position peel open. Okay, sweet. So gtc we're going to set that to day by default size price. We're good. Time. We're good. Give myself some more chart space. I like sliding it over so that we have three columns. Give me exactly three. There we go. All right. First that's how you know the width is. Is good on Accurator and it gives you all the information here without really cutting it off. Alright, so now I'm going to save this setup. Save my workspace as to execut.