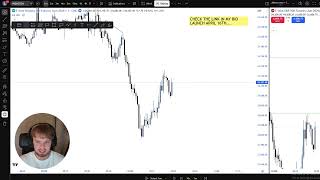
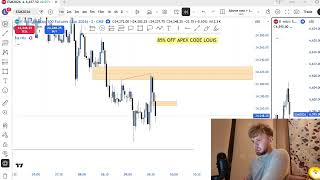
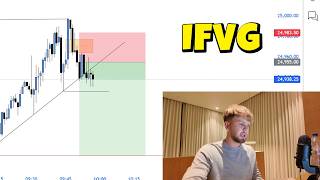
In this single‑presenter YouTube trade‑breakdown, the host walks through a losing long trade taken on a day when his overall market bias was bullish. He begins by reviewing higher‑timeframe analysis, noting that a daily bearish fair‑value gap (FVG) was inverted by a bullish candle close, which gave him confidence that price would move higher. He then scans the 4‑hour chart (no clear bullish FVGs), the 1‑hour chart (a south‑side liquidity sweep that reinforced his bullish bias), and moves to intraday 2‑minute and 1‑minute charts. He explains how a bearish SMT (short‑term market structure) formed on the ES futures contract at a high of 943, while the Nasdaq did not, indicating a short‑term bearish bias that could be taken if liquidity was not already swept. Because the internal liquidity point had already been swept, he decided against a short. The price then retraced, creating a new bearish FVG on the 1‑minute chart that he intended to use as a breakeven stop and a 1:1 risk‑reward entry for a long position. He outlines his planned trade execution: move stop to breakeven after the ES high was retested, then trail the take‑profit as price moved higher. The trade ultimately hit his stop and resulted in a loss of $4,354. He reflects on the loss, emphasizing that the same high‑probability setup, if repeated over many days, weeks, and years, would generate substantial profits. He stresses the importance of sticking to the model, managing risk, and maintaining psychological resilience. The video ends with a call to subscribe, enable notifications, and comment, noting that few viewers watch the entire breakdown.
Chapters
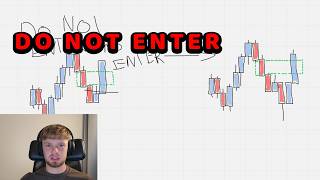
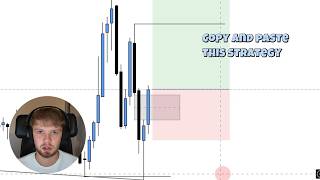
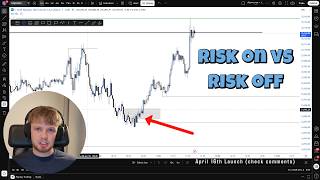
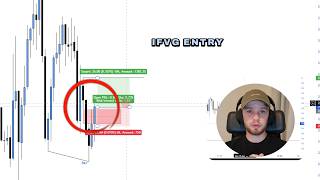
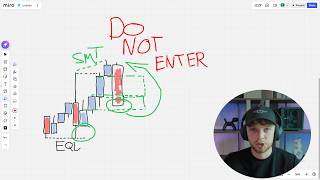
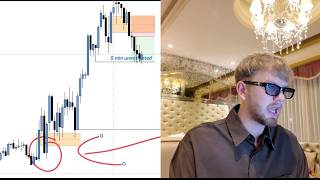
What is up? This is going to be a full trade breakdown today. Now, we missed out on some great shorts because we didn't get the right entry, and I actually took a losing trade today. I took longs following my daily bias being more bullish, and it was a great play to take. And I know, although today this was a losing trade, if I take this trade over multiple months, over multiple weeks, and multiple years, it is going to make me tens and tens and tens of probably hundreds of thousands of dollars. This one specific trade. So let's jump straight into today's price action, starting off with the higher time frame. Now today I was more bullish. The reason why my higher time frame analysis was more bullish— because we've inversed this daily bearish fair value gap. We've clearly got this bullish candle close above this daily bearish FVG. Therefore, I want price to go up. We check the 4-hour time frame, there's nothing really happening. We have failed to invert— well, there is no bullish FVGs to inverse. We've got no unmitigated fair value gaps below that are nice targets. Still looking bullish. The 1-hour time frame, now this is where you could say it's looking a little bit more bearish, but we have already swept this south side liquidity point. So we came down and burst this bullish FVG, but again, we've already swept this south side liquidity point from there and we're rejecting from it. So if anything, this just confirms my bullish bias even more. So today I'm a lot more interested in long positions. We do have these shorts on liquidity below, but overall we have new highs from yesterday as well. I would like long positions. So at open, we don't really get anything interesting. We kind of chop for a bit, we kind of stay in this range. The first thing that happens, which is kind of interesting today actually, is this 2-minute short. So as I said, I am more bullish, but I'm always open to taking short positions going against my bias if the trade makes sense. And right here we are extremely correlated with ES. We have came up, we have created a bearish SMT. As you can see, we have this high at 943. This high at 943 on ES has, has been swept. The high at 943 on NASDAQ has not been swept. This means that we have a bearish SMT, which leads to if we get a short position, it is more likely going to work. Therefore, this 2-minute time frame— everybody on my stream was also looking for it— if we got a bearish candle close below this point, which we did, then we would take a short. The reason why we did not take a short here is simply because we swept this internal liquidity point. Yeah, we swept this internal liquidity point, so therefore the chances that this trade work now drop drastically. It's just a lot more risk for not going against our bias. It doesn't really make sense to enter into shorts here. That's why we could not enter into shorts. And then sadly, the price absolutely dropped. So we literally missed out on shorts by a few points, but that's completely fine. That happens. That's trading. Then what happens? We come down. This is exactly what you want to see if you want to enter into any trades. You need this retracement. The reason why you need this retracement is one, if you want long positions, then you need to come down, inverse that fair value gap, enter into longs. If you want short positions, you want this sort of move where you come down, create internal liquidity, create an FVG, inverse that, that's your breakeven point. Now this is exactly what we get. As you can see, we're extremely correlated on ES. We have a 1-minute bearish up 10:27. 10:27 on NASDAQ, we have this bearish FVG. Now when we're looking for long positions, we want to check, are we— do we have an SMT? Do we have a liquidity sweep? Or are, are we respecting some sort of FVG? In this instance, we are expecting multiple higher time frame FVGs on a 2 and a 3 minute. This is good. We have— this is a singular bearish FVG. That's very good. For context, what are we actually targeting? We have this obvious breakeven point right here and first take profit point because it is above a 1:1 risk to reward. We have crazy good risk reward to all of these highs up here. Our daily bias is bullish. We have a new high from yesterday. This is a no-brainer trade to take. Nice candle close correlated with ES. The way that I would have played this trade is I would have moved my stop loss to breakeven as soon as we swept these equal highs on ES. Then I would have started to trail my take profit point after we take this high. Sadly, this trade was just a loss. It was just a losing trade. After we got stopped out, we get this candle. That's trading, okay? That's going to happen. I will stick to taking this trade every single day for the rest of my life. Every single time I will see in the market like I have done in the past, and it will make me extremely profitable. Okay, that's the number one lesson that you need to take out today. Even though my account is red today, I take this trade over and over and over, and it will make me a lot of money. Okay, that's extremely important, and you need to make sure you are doing that. Then, yeah, that's pretty much all that happened today. There was no other trades. We were— we just came down now, and now it's the 11 to 12 session, which I have been looking at, only looking for potential long positions. Maybe there's something here on the 2-minute. No, just no potential long positions this whole session, sadly. But yeah, full trade breakdown. Make sure you subscribe with notifications on if you like this content on the second YouTube channel. Make sure you comment if you've watched this full video because most people don't make it to the end. And I'll see you all in tomorrow's