Master Liquidity In The Market - (The Most Important ICT Concept)
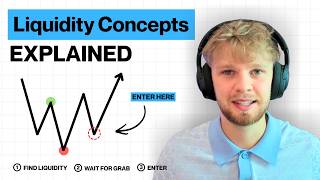
In this instructional video, the presenter denounces the prevalence of misinformation among retail traders and positions himself as a reliable source of market education. He introduces liquidity as the cornerstone of ICT (Inner Circle Trader) methodology, defining it as clusters of stop‑loss orders placed by retail participants. The video systematically explains the main sources of liquidity—swing highs and swing lows, equal highs/equal lows, and trendline liquidity—detailing how each manifests on charts and why higher‑time‑frame occurrences are stronger. He then expands the concept to include Fair Value Gaps (FVGs) as additional liquidity zones. Throughout, the presenter demonstrates how to use these zones for setting profit targets, adjusting risk‑to‑reward ratios, and timing entries, emphasizing that institutions target these clusters to fill large orders. A live‑trade example illustrates the process: identifying an unmitigated daily FVG, sweeping buy‑side liquidity, entering a short position, and taking profit at a lower‑time‑frame FVG. The speaker stresses patience, reacting to market cues rather than predicting them, and warns against common misconceptions about liquidity sweeps. The video concludes with a promotional call to join a private WhatsApp community and a forthcoming announcement on April 16th.
Chapters
I am in disbelief recently with the amount of traders that I am seeing on social media giving misinformation to other unprofitable traders. It's crazy. I'm seeing unprofitable traders post videos every single day trying to talk about what they know, trying to lie about what they think that they know what they're talking about with zero data to back it up, and they're teaching other unprofitable traders to do the same thing. It's unbelievable. So I am taking it upon myself to make sure all of you guys get the correct and right information, because I was just looking through my YouTube literally yesterday and I was like, damn, I was posting IFEG videos over 2 years ago now. Over 2 years I've been trading the exact same strategy and nobody has better results than what I have achieved within my community. And On top of that, I've been doing it live every single day. So in this video, this is episode 1 if you want to call it, and we are going over, over liquidity. Liquidity is the most important ICT concept that you need to learn, and most importantly, you need to understand it, okay? And for you to understand it, you need to know what it is. Now, liquidity— the best way to look at liquidity is simply to look at it as stop losses resting in the market, okay? Okay, so imagine liquidity is something that— where stop losses is resting in the market. Now liquidity is everywhere. If we go and look at the chart, for example, liquidity is absolutely everywhere. It's at swing lows, it's at swing highs, it's at internal highs, it's at internal lows. So what you need to be able to do is identify a relevant liquidity, and that is what we are going to be going over in this video. Now firstly, there is a few main types of draws on liquidity, and you need to be able to identify them. So let's start off. What, how, what are the different types of liquidity? Firstly, you have your swing highs and your swing lows. Now, these are of course are the most common draws on liquidity, and a lot of the time the most reliable. So if we're looking, imagine that these lines are charts, of course, so we're getting down candles here and up candles here. Your swing highs and your swing lows are as simple as it sounds. At every swing low, there is going to be a draw on liquidity. So let's imagine that this swing low. We can draw a line to the right. Now this is your draw on liquidity line. Below this point, this is how you're going to imagine liquidity. Below this point is loads of other people's orders of where their stop losses are resting. Because let's say that somebody— let's say that Timmy has just entered into a long position here. Where is he most likely to put a stop loss? He is most likely to put his stop loss at this swing low. So what does price want to do most of the time? Price wants to come and take me out of that position and take and grab all of that liquidity so then the institutions can trade in the opposite direction, trapping retail traders. Okay, so liquidity is extremely important. So that's your swing lows. Again, there's another swing low, there'll be sell-side liquidity here. There'll be another swing low, there'll be more sell-side liquidity here. If you hear me saying sell-side and buy-side liquidity, sell-side liquidity simply means all of the buy side liquidity that is below in the market, that when you'll be entering into a sell position, you'll be targeting sell side liquidity. And of course, buy side liquidity will be the opposite, all of the highs in the market. So here would be a swing high, for example. Now, what is important about liquidity is once liquidity is swept, it is gone. So for example, here we had this swing high. Price action— let's say price action was down here. We just started to get this move up. We had this swing high. So from the swing high, we draw a line. As soon as this liquidity is swept— now that can be with a wick of a candle, or that can be with a body of a candle— now this liquidity is deleted and we no longer use it, or we no longer need it again, because all of these stop losses has now been tapped into. And I'll go in later in the video, I'll start to talk about how you are actually going to use this liquidity to your advantage. So Now let's look at a different type of liquidity. Now this is one of the stronger draws on liquidity, and it is equal highs and equal lows. Now it's very self-explanatory, okay? Do not overcomplicate this. When price action comes to the exact same point in the market more than once— the exact same point, it can't be relative, it can't be close to, it has to be exact— so let's say the price action is at 25,000 exactly, let's say this point in the market at $25,000, then this point also needs to hit $25,000 and does this and does this. You need to have at least 2 taps for it to be equal highs or equal lows. The more taps, the stronger that draw on liquidity. Now, another thing with liquidity is it is usually stronger on the higher time frames. For example, if we have equal highs on the 1-minute time frame, yes, they are a strong draw on liquidity, and most of the time statistically they will get tapped and they will get swept. Swept, by the way, just means when we take liquidity. So if we have 1-minute equal highs, let's say, that is very good. But if we were to have 5-minute equal highs or 15-minute equal highs or even 1-hour equal highs, then that is an extremely strong draw on liquidity, and that will be a great target. Now again, I'll talk about how we're going to use liquidity later in the video. Right now, I just want you to make sure you know the different types of liquidity. Again, we have— let's say that these are equal lows. Price action comes to that exact same point in the market more than once. Perfect. So that is your equal highs and your equal lows. Remember, make sure you're making notes. You need to know this. Next, you have trendline liquidity. Now, recently, trendline liquidity has been ridiculously accurate. So trendline liquidity is simply when you can draw a trendline. So let's say you want at least 3 taps of this trendline. So price hits this trendline once, twice, three times. What does this mean? There is lots of orders resting down here, there's lots of stop losses resting down here, and price action is most likely going to come and take out this liquidity. Okay, so now let's talk a bit about how you're going to use liquidity when you're trading. Now, to put it in simple terms, the institutions and the banks need liquidity to trade their money because they have so much money that they need to trade with. So they need to target the retail traders to grab their orders so that their orders can be filled. So the more orders that are resting in the market leads to potentially bigger moves that can happen. So in simple terms, again, liquidity is just a draw on where price action is most likely going to go. So the stronger the draw on liquidity, the most likely price action is going to head in that direction. So for example, we have trendline liquidity here. There's lots of stop losses resting below this point. What price action is most likely going to do— of course, you cannot just enter from liquidity, you need an entry model on top of it— but let's just say you enter into a short position right here and you follow your strategy. It doesn't matter what strategy you are using, and you just find a nice short position. If you were entering into a short position here, where would be the most probable area that price action is most likely going to go? It would be this trendline liquidity. Therefore, this trendline liquidity is where you're going to set your take profits so that you can make the most amount of money. The best traders in the world do not use a fixed risk-to-reward ratio. If you want to become the best trader possible, then you need to adjust your take profit depending on where the strong draw on liquidity is, because in the long run you will make a lot more money doing this. So in this instance, if I was to enter into a trade, I'm not just going to say, okay, look, I'll target a 1:1 risk-reward here. No, I will target where I think price action is going to be drawn to which is this liquidity. Now, a little advanced tip with trendline liquidity: most of the time when we have trendline liquidity in the real-life markets, we like to sweep the liquidity and take the liquidity with displacement. And now, all displacement is, is just a fast-moving candle in one direction. Okay, so this is the 3 main types of draw on liquidity, and most importantly, the most common draws on liquidity. Okay, now I'm throwing you straight into the deep end, and I'm going to you how you can use liquidity effectively to help you trade. Now, first of all, you need to understand what a fair value gap is, okay? A fair value gap, as most of you probably know, is simply a 3-pattern candle formation where the first candle and the third candle don't touch, connect, or overlap. So as you can see, we have 1 candle here, 2 candles here, 3 candles. From this first candle, this first candle does not touch, connect, or overlap with this third candle. Therefore, this is a fair value gap. Now the reason why I'm telling you this is because this is actually another draw on liquidity. Most of the time, statistically talking, fair value gaps or FVGs will get tapped into. Now when a FVG is not tapped into yet, it is called an unmitigated FVG. So currently this is an unmitigated FVG because it has not been tapped into yet. Now remember what I said earlier, most of the time the higher that— well, the higher the time frame, the stronger the draw on liquidity. So if we was going to trade this price action right here, what I would go to is if we go to the daily time frame, look what we have. We have a daily unmitigated FVG. Not only do we have a daily unmitigated FVG, we are extremely close to this draw on liquidity. So it only makes sense for us to come and take this draw on liquidity. Now, if I drop to the lower time frames, can I do much with this information in terms of entering into a trade? Now, with my specific strategy, sadly, there is no trades to enter into. But that is okay, because not only are you going to use liquidity to take profits, you're also going to use liquidity as context to enter into another potential trade. So look here, we have this daily unmitigated fair value gap. Remember that daily line? Price ends up coming and tapping and sweeping this draw on liquidity. Now this comes to my next lesson. Once a draw on liquidity is tapped into or swept or taken, whatever you want to call it, it does not mean that we now have to go in the opposite direction. This is a very common misconception with liquidity in general. So just because we have swept this high does not mean that we have to come down. But if we do sweep this high and then you see the rejection afterwards, this is a very good sign. Remember, when you are trading, you're not trying to predict the markets, okay? You're simply trying to react to what the markets are telling you it wants to do. So we wait, we be patient, and then look what happens. We can see that we start to get some rejection from this point right here after we have swept this strong draw on liquidity. Now what we can do is, okay, now I can look for my entry model because I have context, context that we just swept out and we just took out all of these stop losses that are resting here. Now price action is seeing a rejection, so if I can enter into the markets, that would be great. Now luckily enough for me, I have the best trading strategy in the world and I enter once a fair value gap gets disrespected. Don't worry if you don't know what this means, that's just simply my entry model. It doesn't matter what entry model you trade with. So I enter into short positions right here. Now this is another great question: where would I take profits in this instance? Now the safest bet on where to take profits is if we look at the higher time frames. What would you notice? We have this 5-minute unmitigated FVG. Now remember what I just said, most of the time fair value gaps will statistically get tapped into. Once a fair value gap gets tapped into, the same with this daily fair value gap above, once this FVG gets tapped into, we now no longer know what is going to happen. That's the complete honesty. Once we tap into this FVG, we do not know if it is going to get embossed, we do not know if it is going to get respected and then go in the opposite direction. So what we need to do with that information is take advantage of what we know, and what we do know is most of the time it will get tapped into. So for this trade, I've now got my entry model. I'm using the context of this sweep on buy-side liquidity, that unmitigated daily fair value gap. Where am I going to take profits? I'm going to take profits at this low because on the 5-minute time frame, this is an unmitigated FVG. And let's look what happens. And by the way, I took this trade live on stream. As you can see, Boom, we perfectly have just swept this take profit point. That is where I took 100% of my profits. Reason being, now we could get some rejection from the 5-minute time frame. And look what happens, we reject straight up from after we embossed this 5-minute FVG. And that is exactly why we use liquidity in this way to our advantage. Now again, we just be patient, you know, there's nothing that we can do. What would I now do in this situation if I wanted to trade? I'd mark out the highs, I'd mark out the lows. Now I know, okay, right here we have a swing high, buy side liquidity resting here, sell side liquidity resting here. There's not much that we can do right now, there's not enough context to enter into any trades, but we're rejecting nicely from that 5-minute. Let's look what happens. So yeah, we're just ranging in between the two liquidity draws right now. I'm not sure what actually happens after this, so let's see if anything does happen. Okay, boom, look what happens here. We've now came up perfectly, swept this sell side liquidity point by having this wick. So now, as you can see, this wick— I'm not sure, yeah, I did go over this earlier in the video. So there's different ways that you can take liquidity. The best way that we can take liquidity is by doing this wicking through the liquidity draw and then getting a move down afterwards, because this shows weakness. And now this shows that we most likely want to come down. I'm really not sure if we do come down right now, but from just seeing this sweep on buy side liquidity and these few candles it would make the most sense to now come and take out this south side liquidity. Would I enter into any trades right here? No, I would not enter into any trades because I don't have my entry model. But if I was to enter into a trade, I would target this south side liquidity because I think that this makes the most sense to come into. Now, if this does not get swept, again, there's no trades to take, but this should— at least we should come down a bit here, in my opinion. Okay, perfect. Okay, so as you can see, we then come down, take out south side liquidity. Now if you look what the difference is here, as you can see, now we take this low. But just because we take this low, does this mean that we now have to reject and come up? No, it does not. We do not have to reject and come up just because we swept the south side liquidity point. Firstly, we do not have a wick rejection, so it is not a clean sweep. We have just displaced through this low. And again, we're not trying to react, we're not trying to predict the market, we're just trying to react. So price action could easily just want to carry on falling down here, and that's completely fine. There's nothing that we can do about it, and that's exactly what price action does. I hope you enjoyed this first video on liquidity. Let me know if you want me to go in anything deeper with liquidity, because I could honestly sit here and give hours and hours and hours and hours of examples. Liquidity is the most important concept that you need to master, and the best way that you'll do that is by time in the charts. Make sure you join my waitlist. I just opened up a private WhatsApp community because I've got a big announcement on April 16th where I'm opening more spots to work with me privately. So make sure you click the first link in my bio. You will not regret it, and I will see you all very, very, very soon.
More from Louis
I lost 4,000$ Today Trading and would do it again next week... (FULL TRADE BREAKDOWN)
Losing 4,354 and i would do it again tomorrow... (80% win rate model trade breakdown)