0:32
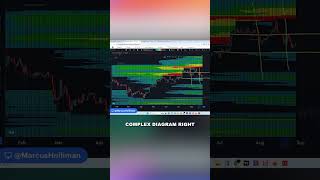
A short spoken excerpt from a YouTube video by Kosta Ouzas ("5% Deviation Below Trend") in which the speaker walks through a complex diagram, naming three levels and alternating areas labeled 'displacement' and 'accumulation', then compares the diagram to a tic-tac-toe grid to simplify the concept.










