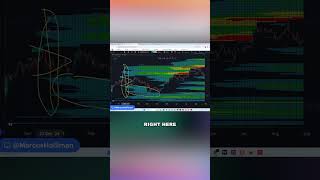
Kosta Ouzas breaks down how liquidity and price action feed each other, with liquidity acting as a magnet for price movement. He maps specific chart levels (10, 25, 5, 3) where liquidity pools, then shows how market makers take forced long positions and sell them at a discount within a fair-value channel.
Chapters
We know that it's pretty. I like to keep things incredibly simple. I'm going to show you guys Here in about 5, 10 minutes an incredibly complex, simplified diagram that you're going to get a kick out of. So basically, it's a simple process. Liquidity is price action, creates liquidity, then liquidity, like a magnet that attracts the price action. Right. So we get a new trading program right here, and the liquidity starts to form on all three levels. This is 10 and 25, 5 and 3. So as that liquidity begins to accumulate, the market makers collectively and institutions, they take positions on the long side. These are forced. These. These positions are forced to sell their leverage positions at a discount. There's like a fair value channel running in here, right here.