Bitcoin Live with the Power Law & Minotaur Team, #32 4/09/2026
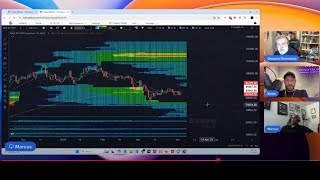
Giovanni and Marcus break down Bitcoin's price trajectory using power-law models and liquidity analysis. Giovanni projects $82K in one month, $124K in six months, and $200K+ in nine to twelve months based on quantile bands. Marcus argues derivatives markets drive price discovery and forecasts a potential $60-64K low before a breakout in 60-100 days.
Chapters
Point Live. I am here with, uh, uh, Marcus that is from the Minotaurs team. Uh, we are going to discuss, uh, uh, the market like always. Uh, today, um, we don't have, uh, Kosta Ouzas with us because, uh, he's, um, traveling. In fact, he's going to the conference. We will all be at the conference We are going to have like a booth ourselves. The monitor, Luca, I guess you can check where the different booths are, right, Marcus? Or do we have an assigned number or something?
Yeah, you just have to check the floor plan when you get there.
Yeah, the floor plan. If you are, if you go to the conference, come to visit us. So you can meet us in person. Uh, I will have a bunch of books actually, uh, you know, my Physics of Bitcoin book, and I will, uh, sign them for you if you want a physical copy. Um, yeah, so yeah, it'll be fun. It would be nice to meet a bunch of people, um, if you come in Las Vegas. Okay, so, uh, it's actually a very good time because, uh, it seems that Bitcoin is in the upward movement. Uh, let's look at some charts. We always start with the Power Law chart. Uh, I usually show you different ones. I like this one, it's a combination of two of my favorite indicators. This, this one that you're seeing with the different color bands is a quantile. So basically how it works, it takes, uh, uh, the different, you know, it looks at the distribution of the values of Bitcoin. You do it in this space that is, uh, you know, give us input the log of time and the log of price, and then it looks up how the price is distributed, right? And it creates these bands, uh, in based on quantile. So You can see here a table, 0.5, 0.1, 0.2. So basically it's adding more and more data to, to the spread. And you can see the lower quantiles are here. It's very cool because if you keep the data up to the, let's say, maybe even 5% quantile, you're getting this very, very clean power law. In fact, this is a blue curve that you're getting is exactly that. It's, it's one of the lowest quantiles, and it's a, it's a power law, basically. And in fact, all this quantile up to basically a 50% quantile with this, this blue line that you're seeing here are all parallel power laws. If we plotted this in a, in a graph where we add the log on the x-axis, the TradingView doesn't know how to do, you can just take a log of the price, then this curve will look like a straight line. And in fact, all the curves below this blue line, between this blue line and this purple line, will look like straight lines. It's really amazing. Now, as we go up, you're seeing a little bit of bending, you know, they are not parallel anymore, mostly because they are trying to take into consideration this decay of these peaks. The peaks are not equidistant from the purple line or even the blue line, they are decaying in time and so they're still power law because basically all these lines, now if you, we don't, you see just colors but if we add the lines it will be all power laws but they they start to look like we are converging towards the blue line because of, of this decay of the peaks. On top of this, uh, um, again, you know, the color code tell us how big the deviation is. The table is actually projecting, uh, to, to several months in the future. Uh, right now, for example, we are at around that 0.16 percentile, so we are pretty close to the bottom, but not quite. You can see the bottom is here, and we are, we have been above, uh, the bottom. We didn't touch it, we came very close to it. Then now we are trying to leave it, uh, and it's projecting ahead of time. So let's say, let's round it to 0.2 percentile. If you continue to stay in that region, um, you know, the projections are, uh, right now it's 82K, right, close to 80, basically 89, uh, in 3 months from now 96K, because the quantile go up, right, um, because the power law go up. So even if we stayed in this quantile, that probably is not the case, I think we are leaving and going upwards in few months from now, uh, we should go up to the 100s, right, in 9 months from now. But probably we are going to be much higher. Maybe we go back to the median. This blue line is actually the median. If we did the normal type of regression, it will be what is called the mean instead of the median. The median is a little bit lower than the mean itself. There are two different ways. In fact, the mean, this is the mean, is this lighter blue line. Yeah, this line here, um, it's a little, you know, it's a little bit lower, but they just give different information. It's not that one is better than the other, you know. The median is a little bit more conservative. So if we stay, let's say we go back to the median then let's say in 6 months from now, right now we are April, let's say November, we should already be in the $124K. So it's a very nice table because it allows you to project. You can find that, by the way, all these, uh, um, we have right now, I think it actually went to even 16 or 17, I don't remember. We have a package of several indicators And if you go to my main website, bitposidon.com, you can sign up for them. It's a relatively inexpensive service. I think you get all of them for $20, something like that. And this is one of them. The newest one that I think is actually all 16 or 17. Let me actually turn off the quantile model so you see better. You can superimpose them, right? Um, is this other model that shows simple power law, and then this band that is associated with these, uh, what they call the log-periodic model. Basically is the idea that these oscillations, they are not periodic, they are not happening, for example, every 4 years, but it's kind of an illusion. Uh, it says that there are 3 different peaks. It's actually something more complicated. It's like you can think about almost like a, you know, 1 peak and 2 side lobes or something like that. And these 3 peaks are repeated over time, but every time you repeat, this is why they are called log periodic. Again, if we did this, if we had the possibility of taking the log of time, time, that TradingView unfortunately doesn't do, you will see these 3 peaks repeating, repeating perfectly in this space. They will not look stretched, they will look perfectly the same. But because we are in log space, it will take longer and longer for them to manifest, right? When you plot them in the normal time, it looks like this structure, you know, these 3 peaks. Like, I'm going to count: 1, 1, 2, and 3. It's being repeated. Look at this, 1, 2, and 3. So it's being repeated over and over, but now notice how it's stretched. It's being stretched almost like it's the same structure but being like in a rubber band, like this green band is made of rubber and you're stretching it. Um, and now you see again the same structure repeated here, right? Peak 1, peak 2, and peak 3. And I know it sounds weird that these two peaks are actually part of one big structure, but this is what the math says, you know. And you can see how well it can catch all this. Not just, you know, me fitting it by hand or doing— it's math. You go, you calculate the, you know, what is called the spectrum. You see this peaks in frequency, say, oh, there is this signal that has this frequency, but they are not normal frequency, they are called log periodic frequencies, and they are very strong signals. And, uh, when you add them together, you reconstruct the signal, what he thinks the cone is doing. And it's incredible that he's actually picking up all these oscillations. He's even picking up this little bump here, right? Look at this. Here is a little bump, is there is a bump here. So, and it's telling us if this interpretation is correct, that this was actually one big structure. So many people think, oh, this was one cycle, this was another cycle. This mathematical interpretation says no, you know, it seems like that, but then you don't explain why we had a peak here. And instead, with this three-lobed structure, you can say, yeah, this was one part of a structure. This was the second part. This is the third one. And it doesn't distinguish— many people say, oh, we had a double peak. It doesn't care about that. It thinks it's one big oscillation there. And, you know, within a VET oscillation, you can be anywhere inside this green boundary because that is accounting for the volatility of Bitcoin. So, and in fact, all these, all these, all oscillations are within the band. And what is cool, if you keep this interpretation, is many, many, many people, me including, uh, before— because, you know, I, I revisited— this is a model that I tried many years ago, and then I abandoned because, like many people, I got confused by these peaks being 4 years apart, this one, this one, and this one. If you adopt that idea that this is a cycle, 1, 2, 3, then you have to throw away this one because it is 2 years away from this one. But notice what happened in this model. This cycle is included, and even this little oscillation here is included. It's just really incredible, you know, how well is, you know, covering all these oscillations. Now, you know, I have to be a little bit honest, this is after the fact, after we have all this information, but, you know, we are not really forcing by hand, by following these oscillations, it's the math, okay? The math of— yeah, like, we need to be a little bit careful It's after the fact because now we have knowledge of all these oscillations and we can do this calculation based on this new information. It will have been probably difficult after two of these oscillations to see this pattern, but I started actually around here to fit it with this model, and then once I saw these, I say, well, maybe I was wrong, maybe this doesn't work, you know, so I started to talk about, like everybody else, about the 4-year cycle. But, uh, it's kind of— it's this— the 4-year cycle comes almost like a sub-cycle, you know. It's kind of part of this lob structure. And what is good about this new model is that many people were expecting, according to the 4-year model, a big peak here, right? Even if you included this decay You could say, you could have said, well, you know, including the decay, maybe we go all the way to 200K, right? And 200K is kind of like here and we never went there. You know, we stayed to the 125K limit. And this model said, yeah, that is correct because you are not expecting to see a peak here. The peak will come later. You know, because it's part of this three-lob structure here, and the first lobe has these sides this time because, you know, this frequency interfere with each other. Sometimes they build up together constructively, you have these huge peaks. Sometimes they cancel each other. So in this case, we did have some kind of a peak there, but very, very quiet peak, very small. Now, according to this model, We are supposed to go a little bit more down, so it's a little bit weird that we are going up right now. Uh, it says that we are going up, but it should happen after August. Now we are still within this band, so it's fine. We can still go up a little bit and go down or stay within the band that, you know, we don't have to go all the way down. We just say that this is a natural thing for Bitcoin to do right now, to continue to go a little bit down, but we don't have to, right? We can stay within this band and the model is still correct. Yeah, so this is— but you know, also the uncertainty is in both directions, right? You can have uncertainty in price but also uncertainty in time. So Maybe the bottom instead of happening here, it happened a little bit early, and now we are part of this going up, right? These things are rough, a rough interpretation of what is going on. It's already incredible when we can make any prediction at all, you know. But this supposedly, if this model is correct, these are internal oscillations of Bitcoin Yes, maybe there is some interference with external oscillations, you know, like the market, you know, the different microeconomic cycles, but these are just from the internal structure of Bitcoin. It tends to have these oscillations that are relatively complicated with these three lobes that repeat and stretch over time. We will see as we get more data, we will see if this model is correct. Anyway, uh, this is my analysis for the day, so I'm going to leave the floor to Marcus that we look at the liquidity.
All right, let me, uh, share my screen. Let me know when you see it. I'm on one monitor here.
Yep.
Okay. All right. You see that, Giovanni?
Yeah, I see. Perfect.
Okay, great. All right. So where are we today?
Okay.
I love liquidity and liquidity I trust. I don't trust the orange man, but I trust liquidity. Uh, just to give a backstory here, we can see the entire cycle or a lot, big chunk of it since 2024. Uh, we're going to start there just to get some context. Um, one thing that, uh, jumps out at me that I want to be clear on, that liquidity, uh, creates price, it attracts price, and price action creates liquidity. So they're one and the same thing. Without the price action, you can't build liquidity, right? This is the price action, this is 2024, and that creates the liquidity which attracts the price. So the classic chicken and the egg, right? So one thing I want to highlight also, the reason we're— what we're looking at here is we're looking at the derivatives market on Bitcoin, Binance, Bybit. They're all basically the same. The reason we look at derivatives instead of spot is derivatives is where the leverage is at. Markets are basically a leverage and deleveraging engine. It's like a wrecking ball. And wherever the leverage is, that's where the bubbles are created, and that's where the bubbles pop first. And then price, the asset, gets in parity with that. So that's why we always use derivatives. So this is what we're looking at now. Another thing I wanna highlight here is something called auction market theory, ATM. And the market is always seeking fair value or value, and then it goes from a period of balance. This is 2024. We want a long-term balance here for about a year, 9 months or so. Then it goes from a period of balance to imbalance, or they call it discovery, where it finds another area of balance where prices are accepted. So this was in, uh, uh, November, uh, late 2024. So we went through imbalance or discovery to balance, and that discovery process is when liquidations occur, when it liquidates liquidity. Takes liquidity. Then we went into, uh, an imbalance or discovery phase, and we found balance. Then we went to imbalance or discovery, and we found new balance. And then we went to discovery to the all-time high. We were here about, uh, 100 days at the top, and then we found balance. Then we went discovery again, took out a massive amount of liquidity there, and then we found balance again. Imbalance and a new value area of balance. This is where we are currently right here. We're gonna, we're gonna get into this right now. What I want to show you is the market is incredibly structured. It's a structured environment, and you can see that it just goes from balance to imbalance or discovery, and it finds a new value area of balance, and then it trades there where commercial traders conduct business, and then it discovers a new area. So, uh, I always find that very interesting to see the market like that. And if you can see it like that, it tends to make it somewhat predictable, uh, because of those tendencies. Another thing I want to cover here is distribution. So big players are conducting business in here. This is the volume that they need to buy and sell and, and, and produce positions. Also, this is the price action that creates the liquidity. So what I want to go over now is really quickly, we're going to go over distribution and accumulation, right? So when we have areas of accumulation right here, for example, if you liquidate this amount here, you have to, you have to balance that toxic inventory off somewhere else. So you tend to move that inventory over here and you, it just moves from one area to the other. What I want to go over is the— let's look at this accumulation zone here. This is an accumulation zone right here, right here. This is what we call a Model 1, where the lows take out the, the previous low is taken out by the late low, right? So this is Model 1, and Model 1s tend to— where you have the low is taken out, each low is swept each time, that tends to lead to reversals where we can discover in the other direction. We have a Model 2. This is a Model 1 also, where the highs are taken out by the previous— highs are taken out. That's a Model 1. Here's a Model 2 where the high is not taken out. It creates higher, higher lows. Sorry, higher lows. And retail people call these bear flags, right? But it's not really a bear flag. The market doesn't move because of patterns. The market moves because it conducts business. This way. So when we have these model 2s, they're usually followed by some type of sharp reversal. So the reason I go into that long lecture on context is now we have a premise for what could potentially be happening now. So obviously we have a model 2 where each low— this was the low that we put in in February right here. This was February the, uh, 7th. So then we put in a higher low on the, uh, 26th of February, and then on the 28th of March we put in even higher low. So this is Model 2. It's a form of accumulation, but it's not a complete accumulation, just like we had here, same thing. And what typically happens is these types of accumulations are followed by a sharp spring, which is the Wyckoff methodology, which is the spring before we move higher permanently, right? So we're setting up for that. And these types of moves— this is what I call a Jenga move because it's just like a game of Jenga where you're just constantly stacking higher, higher, higher, higher. It's a very artificial type of move that tends to not last very long because at some point that's going to fall apart. And this type of move builds in a tremendous amount of liquidity, gets built below there, and the market comes for that just like it did here. There's a lot of liquidity, late longs, a lot of people chasing that because sentiment starts to change, then the market takes it out. So we have a classic model too, which leads me to believe that we're going to sweep this low at some point, just like we typically do. We have these types. Here's a model 1 right here. We swept before we could go higher. Model 2 swept before we go higher. So now let's take a look at the liquidity itself. There's a good look at the liquidity. Now there's a couple of things that jump out when you have a displacement where you take out a massive amount of liquidity. The market usually forms a new auction or a new fair value to create the new liquidity. When you take out liquidity, you create a void where there is no liquidity remaining. So once you take out the previous liquidity, there's a void, and this void is the birthplace for new liquidity. As you can see here, we have new liquidity coming in. So then at some point, the market is going to break out. That's what creates the breakouts to go harvest that liquidity that has been built up.
But it doesn't seem very deep, right, at this, at this particular moment?
No, not as deep as has been in the past, right? Your observation. And to be honest with you, in this particular phase of the bear market, volumes have been— trading volumes have been low. They've been a little bit historically low. So that typically happens at the bottom of a, of a bear market, is, uh, people don't— retail and smaller traders don't buy the lows. They buy the highs. They, they, they participate when it's euphoric. This is when the retail buys here. They like to buy up here in this area here. This is when they buy.
Yeah.
And they sell down here and they don't buy here. They wait until it gets euphoric, which is the absolute worst time to buy. But yes, the volumes have been down, which, which can be evidence and these rather partially pools here, they're rather skinny. However, they do exist. Now, I actually thought this could potentially be the bull trap right here. This move, it was a little bit early because we had the similar bull trap here, but it's a little early and this was not the move. And the reason it wasn't the bull trap here that turned into the bear— the bear move to take out the liquidity was the market was incredibly bearish. Sentiment was very, very strong in this area at that time.
Yeah, I remember everybody, all they were going to zero.
Everybody was saying we're going to zero on this move. And what does the market do? It's a wrecking engine. Too many people get on one side of the seesaw, it's going the other way. So no, it did not make the move there. What it did was it squeezed all of those late bears that jumped on right in here. When influencers were just running crazy, and now it's squeezing them right here with this move. I do not anticipate this liquidity to be taken because in my opinion it's too early for that. It, it looks like it's knocking on the door of that. We might tap into it a little bit more, but I expect this house of cards—
this is an extremely manipulated move right here to finish, and that will align with my long periodic would say that we are going to have some kind of a bottom around, you know, yeah, this summer basically.
Yes, because this is incredibly manipulated. It's going to change the sentiment. People are going to start longing this very late and they're going to get wrecked.
Yeah.
So let's take really quick, before I wrap up, let's take a quick look at this area here. Let's zoom in. Uh, got another screen here. All right, this is the move at the 4-hour time frame, so you can see it right here. Uh, very, very manipulated. Draw a little quick little spaghetti trend line here. So yeah, you can see right there, had a lot of liquidity to attract the move. You can kind of tell the composite operators or market makers are kind of going for this liquidity here while they squeeze out all the shorts, all these late shorts here. There they are, they're getting taken out. But at the same time, there's not a lot left up here to go get. So these late bulls, there's a lot of bulls coming in here right here. I'm going to show you right now. These late bulls are getting ready to get harvested, wrecked. So now look at what's below us. Why I didn't show you that in the beginning. Look at that. Look at that.
Yeah.
Yeah. Massive.
And that is around 60.
Yeah. 60K.
60K.
Below there. 59, 60. Yeah. In other words, we need to sweep, uh, we we need to sweep this original low right here. That low, that's, that's how we set that, uh, that's how we set that Model 1. So coming back really quick, that is—
and it doesn't mean that we go all the way there, but it's an attractor. It's like a— yeah, it's a magnet.
I think for a healthy bull market— let me turn this, uh, liquidity off for a second— for a healthy bull market, we need to sweep this low. We at least sweep that low. This is over here. We need to sweep the low. That was the original low on February 5th.
I'm just going to check what, uh, the bottom is. Um, let me— I want to see where— no, go ahead, go ahead. I'm going to check the bottom of it.
But in my opinion, Louisiana, that's fried chicken. Popeye's right there.
That's I love Louisiana. I lived in Louisiana for 7, 8 years.
You're familiar with—
they have a lot of good fried chicken there.
Yes, there you go, right there. Louisiana's finest right there. That's trap money right there waiting to be harvested. So market makers, they come up here and slam— I can't get my pen going here.
Yeah, come up here.
Yeah.
So if we stick to bottom, and that bottom is in August. Yeah, my chart says 64.
Yeah, any— anywhere in this zone, there's a zone here.
Yeah, but it's kind of what you have here, right?
Yeah, we might not stay here.
Maybe the upper limit of that.
Yeah, yep, good confluence there. That's about it, all I got right there on that.
Good. Yeah, I mean, it's interesting time. I think, you know, Maybe there is some short pain. I mean, it's not a big deal for us. It's actually a good opportunity, right? Because we can take these swings and make something out of it.
Yeah, you know, the storm, hurricane's coming, get ready. You can sell. Yeah, make money from it.
And, uh, you know, we usually have a Kosta Ouzas of the action of the algorithm. The algo, um, if you come to Las Vegas, you can meet us. We will have screens, we can talk about the algo there in person, show you how it works, you know. Um, I think once Las Vegas is over, uh, we are going to go back, you know, to the normal, uh, um, shows and show you some of the actions that happened, you know, during these swings. Kosta Ouzas or Sebastian Sarah better in explaining that kind of action. But yeah, it's, you know, if you have a system like these, it's amazing, and it's fueled by these oscillations, you know.
Yeah, I mean, that's all that's driving it. Is another thing I would like to highlight now here is The, uh, trading volume ever since the NASDAQ was created, the day I was born, actually the month I was born, '71.
Oh wow.
The NASDAQ, the National Securities Automated Quotations, that's what is electronic trading. Now the legacy markets like the stock market is about, uh, 80%, uh, algorithmic, right? But the highlight that I want to bring out here is crypto was born of algorithms. It was born of electronic trading. It's 98%, 95, 98, 99%. So it knows, it knows nothing else but algorithms. So the point that I bring out is if you are a manual trader, let's just say you were a farmer, you could, you could run a business, a farming business. You could run a farm with a hoe and a shovel and you could do it manually in your backyard. But if you wanted to scale up, you'd have to get a mule and a plow or something, right? And then ultimately you could get a combine and a commercial operation like we do today.
Absolutely.
The core— the analogy is, why would you try to manually trade in an environment that is all almost 100% algorithms?
And with the farming, you know, you can do it at home and have some fun, but with trading Yeah, it's not much fun when you're losing money, you know. Yeah.
I mean, if I was going to treat this as a business, just like if I was going to be a farming— in the farming business, I'm not going to go get a hoe and a mule. I'm going to go get a tractor and a combine. Well, it's no different here. If I'm going to trade in cryptocurrency, which is 99.98% algorithms, I wouldn't even attempt to get into that business without having an algorithm of my own. Yeah, I agree.
Of course. By the way, you were born February 8th?
October. But NASDAQ came out in right about the same year. Yeah, same year.
Okay.
Yeah, I was born for this.
Nice. You look younger for your age. Incredible, man.
I got that Denzel, uh, it's a, it's a fried chicken.
All that fried chicken.
Hey, I got that Denzel Washington starter kit. Yeah, you are. Yeah, it might not be Denzel, but I'm the poor man's version of it.
No, it's good enough.
Yeah, good genes, man. Good genes.
Very good genes. Um, okay, let's take some of these questions, uh, and we mostly— are there for you? Sure. Uh, go ahead. What is Marcos going to do since his price target 57 never occurred?
Oh, I am waiting. I am, I am holding my breath. I cannot wait for that to hit that 57, 60K range. I am sitting on a lot of dry powder. That's where I'm going to deploy it. I've been waiting a long time for those prices. It's kind of like if you were going to buy anything else, you're going to buy a home or a car, you want to catch it on sale, you know. So Bitcoin, I'm waiting for it to get on sale, and I'm going to back up the pickup truck and just load up on it when it gets there.
And guys, already there, General, you know, uh, it's already good that we can do some prediction, you know, and see what the market does. Remember, it's always stats, right? So even if we— a particular week we say looks like we are going there, you know, it's not 50/50 because we— most of the time we are right in, uh, in these predictions, but that is never 100% either, you know. Yeah, we are talking about probabilities here. Anyway, uh, and you know, the entire approach is you look at scenarios and then you have an action, right? You say, okay, if we do these, then we do that. If that happens in this way, then we do that. That is the way you want to approach these things. You know, you want to have a plan for every opportunity because it's never 100%. That is why, for example, the trading system that we develop, it works on certain principles, certain bases, like for example the floor, you know, that we identify with the Power Law. And that is one of the, let's say, anchors. But even there, you know, if you want to be safe, you always add some level of management, you know, risk management on top of that. But in general, you know, it doesn't care about if a market goes up or down. It's taking care of how you react to these actions. You know, that is the right approach. Anyway, here, here, uh, another question for you.
It's a pretty interesting question, right?
Marcus. This is Marcus with a K. Okay, Marcus. All right, cool.
All right, I like that name. All right, so he says, uh, if liquidity attracts price How come Bitcoin bounced off perfectly 5x liquidity pools at $80K? Shouldn't it just push through the 5x and liquidate the whole pool? That's a good question. That could, that could be an— I could speak on this for an hour, but I'm gonna give you the short version of that. Uh, first of all, the market is fractal. So there are liquidity pools and, uh, leverage compositions at all different leverage amounts, 100x, 150x, 200x, and everything in between, 50x, 25x, 10, 5, 3, 2, 1. So all those liquidity pools and all— and so there's all this different leverage compositions. And on top of that, you've got all these different time frames from millisecond, which is the world of HFTs, high-frequency trading desk, Then you have, you know, 1 minute, 5 minute, 15 minute, 10, 1 hour, 4 hour, daily, weekly, all that. So you have all these different timeframes with all this liquidity densities, all fractally, all fractal, doing the same thing at their interval. So there's money that is round trip, what I, we, we call it a market, we call it an industry, we call it round tripping. So when the high frequency, which is gonna be taken out first, the highest leverage and the shortest timeframes, they round trip in the milliseconds, so very, very fast. Then you have 1-minute traders or trading operations and desk and algorithms. They're round tripping at 1 minute, then 5 minute, 15 minute, and so on and so forth. And when a, a lot of times moves are very fractal, right? It just might be a quick wick and back down. Well, that particular round trip did not, did not recruit higher timeframes. It just stayed in a very micro, micro level. So eventually what happens is trends are formed by large timeframes, larger algorithms, and larger, uh, commercial operators being involved. And that's what creates these longer trends. So when you're looking at that 5, That is the, that's knocking on the door of larger timeframes or larger money round tripping. And, uh, what tends to happen is you have to understand that all liquidity, all liquidity is being taken all the time. So when you're looking at that 5x that I was using in the example, it may take 6 months and 20, 20, uh, percent range to take that liquidity out. Like 3x. That's how you get a bull and bear market, is it's just the 3x and 2x liquidity being taken, and it just takes 18 months to take it all out because it's so broad and so wide. So everything's being taken all the time, and what happens is before one tier— before it moves from one round trip to the next, it bounces off of it to completely consolidate what it's working on, and it moves to the next tier. then the next tier. So that's what happens. That's why it's tapping on the 5, but not taking it yet, because it's not there yet. But the 5 will be taken as the 3 and everything else. So that's a long-winded answer, but that's about— it's a very interesting topic that you can go extremely deep on. But yeah, good observation.
Good question. Very good. And there is a part 2 to that question.
Okay, let's see here. What is your updated outlook on the duration of this phase of the market? We are now longer in this period than your early prediction, 60, 70 days. Yes. Yes. That's the only other point that you brought out another point. So we, I talked about just now, I talked about the composition of the leverage and the timeframe, but what I think I did not mention was the time itself. Time is also just as important in these round trips. As well. Uh, typically 5X to be liquidated, reestablished, and build new liquidity takes— it stays in those zones for about 60 days. And we are past the 60 days, but it can go as long as 90 to 100 days. So they're not perfect, but it's, it's— we're at the, what we call the maturity phase of it. Yes. You remember when I showed the liquidity, you saw how concentrated it was. We are very— we are in the mature zone. So at any time we can break out of here. And that's what I always say on the calls. I say get your boarding passes because we're getting ready to board the plane. We're moving.
I think, I think there are a lot of signs indicating that.
Yeah, there is.
And you're looking at derivatives, right? Yeah, absolutely.
Yeah, we start with—
it's already including paper Bitcoin because that is derivative. But don't undervalue— a lot of people are you know, dismiss the paper Bitcoin like if it was a bad thing. It's actually— it's a good thing. It's a good thing that we have these derivatives, you know. It indicates a more mature type of asset, you know. The market is more interesting and complex. I mean, the fundamentals of Bitcoin are not changing because there is, uh— this is why there is the power law. The power law tells us, listen guys, you know, the details can change The trajectory is the same. Bitcoin is behaving exactly the same way that it was behaving when it was $100, when it was $1,000. That is what the power law tells us. Now, on top of that though, as you grow, right, you are always with yourself, right? You— I am myself, like the Giovanni that was when he was— I was 5 years old, the same Giovanni, but changed, right? Hopefully for the better, because I have more experience, whatever. So as Bitcoin scales, it needs to have more things going because otherwise, you know, it could not be sustained just by a bunch of basically hobbyists, right? This is why we want the paper Bitcoin because it's a— it's the professionals that are coming in, right? That are— but the essence of Bitcoin doesn't change. So yeah, the best of both worlds. You have this asset that is growing this predictable way, and then we have all this volatility on top of it. So it's really a trader paradise because, you know, it goes in a certain direction over time, so you're not losing all your money in something that goes to zero. And at the same time, there is all this volatility that if you are interested— you don't have to, you can just hold— but if you want to play a little bit and learn how to trade, learn to how to get some kind of yield from your Bitcoin. I do options every week now. I'm doing actually covered calls every single week. I get $200, I get $500, I get $600. A little bit, you know, where I don't feel worried at night. But hey, if I do $600, $700 every week, it's not bad, you know.
You're collecting those rent checks.
Yeah, I pay my rent, you know. So you're basically— you can learn these things, it's interesting, it allows you to learn a lot of interesting concepts. Don't do it in a degenerate way, do it with a plan, with knowledge. You can use our algorithm and it does that for you instead of doing manually, uh, and, uh, and, you know, and, and hopefully that compounded over time, it gives you more Bitcoin. So, you know, it's actually a great thing that we have a PayPal to Bitcoin derivatives gives the asset more value.
I mean, yeah, imagine if we, if we traded real estate where you had to pay cash for everything, you know, by having the derivatives market, you, it's all these synthetic products, you know, it just makes the asset that much more valuable and that much more gives you that many more ways to make money with the asset. So I welcome derivatives and all the synthetic things that they build on top of Bitcoin.
And that means also the industry is interested in Bitcoin and is considering it a valuable market. And yeah, anyway, uh, we have some fried chicken funny comment there. I didn't know that there was that, uh, you know, chicken emoticon. Uh, okay, and then where is this one? Show. That is for me, uh, given a liquidity picture, I don't know. Uh, I mean, look, the support, I say all the time, right, it's an ad-hoc, it's not part of a theory. And it's actually surprising because the power law theory, remember, it's order of magnitude, right? So it basically means anything within a factor of 5, so Even if we have a correction that brings us down to, you know, 80%, it's still valid because in the end what it tells us, look, they're still going up by this factor of 10 within this time, right? Even if we have these wild oscillations, it's incredible that these oscillations are in the lower band. They are capped to 50%. It sounds a lot, you know, but when you have a phenomenon that changes by a factor of 10, it's not a lot. And it's only— weirdly enough, it's only in the lower part. It's actually mathematically is 1 sigma. So usually the distribution, right, if it was a symmetric distribution, within 1 sigma you have only 65% in both directions. And instead everything stops there, right? We don't have on the, on this side is almost like it's truncated. On the side of the distribution, everything is contained within that one sigma. It is weird. Usually distribution don't work like that. The only explanation that we have so far is that has to do with the cost of production of Bitcoin. In fact, you could produce a power law. In my book, if you read my Physics of Bitcoin, I have a graph like that where I calculate the cost of production using hash rate because price and hash rate are related. Price is equal to the square root of the hash rate, and then you multiply by, you know, some electricity cost, and you're getting this power law. And weirdly enough, it's that support line. So while it's not written in stone that we should never cross it, there are some very physical reasons why it's there. And it's really cool because You know, NASDAQ doesn't have it, S&P 500 doesn't have it. It's because, uh, you know, there is not really a cost of production for these things, but for Bitcoin there is. Uh, and, and with gold, you know, gold, the cost of production can change so much, uh, because it depends where you go and find it. Uh, and there's also something that limits the value of gold, because if gold goes too valuable You know, this is what happened. There were people stealing. I was told by some lawyers in Italy, there were people stealing, uh, gold from cemeteries in Italy. They were going in the cemetery, opening, uh, old tombs to look for gold, you know, like wedding bands or things like that, because people start to do crazy things when gold goes so high in value. There were people mining in poisonous places all over the world because they didn't care. The value was so high that people started to take crazy risks, you know. And if it goes too high, people will start to mine it in the depth of the ocean, you know, even if it costs a lot, they will do it because the price goes up. With Bitcoin, that doesn't happen, because if you start to, uh, mine it too much, it doesn't matter what is the price, uh, you know what happens? There is a difficulty adjustment. It makes it even more difficult. And this is why Bitcoin is so different from everything else. It's why you should read my book where I explain these things. It's a, it's a system. It's a, it's a very different asset than NASDAQ, gold, and everything. It's a, it's more like physics, you know. Sure, there are certain similarities that I call these liquidity analysis, but this in the short term, right? In the long term, there are these principles that only apply to Bitcoin because it's a system, it's a complex system. It has all these feedback loops that you don't find in other assets. It's so unique, you know. This is why we only talk about Bitcoin.
Can't you think it'll be kind of like the power laws of gravitational pull? You might, you might exactly might move in there, but you're coming back to the gravity is going to—
exactly. Yeah, it's always your point of reference. So, uh, and, uh, so I'm not saying that is written in stone and we can never break it, but if we do, it will be always temporary and then we go back from it. And it doesn't depend on liquidity. Is, is, I think is a product of that genius thing that Satoshi did to include the difficulty adjustment, you know, to kind of self-regulate. It's almost like a thermostat, right? If a house becomes too hot, uh, the thermostat kicks in, uh, it sends cooling air, it cools it down. If it cools too much, it turns off and the temperature goes down, and you keep that regulation, you know. Uh, so it's— I think it's a very fundamental thing And we have a trading system that is based on this idea that there is that floor, you know, uh, and this is why it's so powerful and very unique. Anyway, uh, I don't know if it has to sweep. Okay, this I think is a question for you.
Okay, if he says if it has to— this is from Alan. Okay, yeah, if it has to sweep the previous low, then it has to go below $60K if it's going to sweep that low. That's correct. Um, but coming back to what Giovanni's saying is, you know, it could be a very fast wick. It doesn't mean it's going to spend a lot of time down there if it, if it does go down there. But yeah, there is a probability that it will. And, uh, but it may not stay very long. We'll have to see how that goes. But yeah, it's going to sweep. That means that Uh, what are—
uh, it's not completely on topic, but maybe I don't know if you have any opinion about these things.
Yeah, I thought so. What are, what are your thoughts on Strategy and their digital credit preferred stock, STRC? Uh, let me be real brief here because that's another— you could open up a Pandora's box with that. Strategy, what Michael Saylor is doing, he's was used to be one of our Bitcoin Moses guys, right? He's one of the biggest promoters of Bitcoin. But what he's doing is he's creating a synthetic product, which we just talked about on the foundation of Bitcoin. It's a, it's definitely better than the banking system that's created on nothing but fiat, right? By decree, at least he's creating a synthetic leveraged product on the foundation of hard money, which is Bitcoin. So if you listen to what Michael Saylor's doing, he's kind of shifting. He was just— he used to be all Bitcoin. Now he has a derivative product and he's kind of turning into a bank in a way, but at least it's on hard— it's, it's backed by hard money, real money, which is Bitcoin. So, um, Yeah, he's got a lot of—
finish your thoughts. Yeah, finish.
He's got a lot of people that are saying, well, it's going to collapse, it's going to fail. Not necessarily, um, because it is backed by Bitcoin. But once again, he also makes the argument that buying MicroStrategy is attractive to people who would never buy Bitcoin anyway, and it's in there. They, they, they like stocks and equities, but we're different. We're a different community because We just go buy the asset. We know the asset is better, and Michael Saylor is making it available to people who wouldn't buy Bitcoin. So it's a different, different customer he's looking for.
So, and, and I have similar ideas, you know, about all that. I love what he's doing. The only thing I have against Saylor is when he talks about selling body parts for Bitcoin. I love Bitcoin so much, but don't sell any body parts for it. Uh, I know it's a joke, but, uh, uh, I don't— I didn't like when he said that thing. And the fact that I think he could be an amazing power law prophet, you know, or popularizer, because it's so good. And, you know, he has all these, uh, amazing way of reaching people and creating—
he started a lot. He started out like that. But now he's kind of going more commercial institution. Because the thing about it, look at the game that he's playing. You always got to look at what people are doing versus what they're saying, right? He's getting leverage and he's, he's getting money, capital. He's raising capital to go buy Bitcoin.
I know he's doing— so I think he's aware of the power law. But even with institutions, like, uh, I had actually opportunity, I was in Miami a few weeks ago talking to family offices, banks, etc., because I'm working actually as a consultant for a fund that is using the power law. There is a fund, actually a professional fund, is using the power law as a tool, um, to do their long-term strategy. And people were fascinated, you know, people in the industry, they didn't know, and they were very fascinated. In fact Many of them understand it better because they had at least some statistics classes. They understand R-squared. You know, when I show them, isn't this pattern, it has a 0.97 R-squared. They look at me strange when I show them the data and they are surprised and they, they leave thinking about that. You know, a lot of people in the field, they really understand it. And when they know that they discover that Bitcoin actually is following this pattern, They are very surprised, and I don't know, you know, why it's not discussed. It's just a personal thing. I, I— it will be great if he could embrace it, and actually I think it will help him with, uh, what he's doing, you know.
It will be at the end of the day. I would never give Michael Saylor Strategy my money, and they're gonna go buy Bitcoin with my money and give me 10% back when they're making— yeah, yeah, yeah. Why you want to be hustled?
But yeah, what is the Marco is saying there are both institutions and a lot of individuals that don't want to touch Bitcoin. They will actually be interested in this thing. So it's again part of the maturity of Bitcoin that is creating an entire ecosystem around it. You can still buy Bitcoin, nothing is changed. When people say, oh, but Michael Saylor destroyed Bitcoin because this, because of that, of the bank— no. Nothing is changed. How do I have to repeat? Bitcoin is doing exactly the same thing he was doing 14 years ago.
He's taking your money, he's buying spot Bitcoin. Yeah, he's putting leverage on it, he's borrowing against it.
Yeah, but you know, it's taking also people that will now buy Bitcoin and is buying Bitcoin with that, right? So it's actually, it has a role and it's part of actually of the power loss story because it's a The way Pablo says, when Bitcoin is big enough, there will be other agents that are working at a different scale. Like, you know, Marcus was talking about fractals. It's basically the same idea of a fractal. There are all these agents that are working at different scales. When you go to the scale of basically industry, you need somebody like Celo and instruments like this, because otherwise, you know, it's kind of childish to— almost childish or very naive to think that just a bunch of people, uh, will be able to do it. Like, individual will be able to sustain the type of growth that we are seeing right now in Bitcoin, because we're talking about billions of dollars. And calculate, you know, just do a simple calculator. Imagine, you know, what will— how many people will have to buy Bitcoin to actually have that kind of growth, you know, of billions of dollars being introduced in the system, uh, on a monthly basis, you know, it will be unsustainable. And, you know, it's not just, uh, even if you include people around the world, there are people that don't have to make $1, don't make more than $1 per day, you know, that is their pay, you know. So even if your calculation say, well, if we had 1 billion people that put $1, where do you find a billion people that can put $1? There are some places where if you use that dollar, you will not eat. That is your pay, you know. So you need to have institution, you know, to be large entities that are involved. And we are lucky, we need more Salos, if anything. Absolutely.
He's the bridge to the commercial world.
Yeah.
If everybody on this call is very fortunate because your community, Giovanni, they're, they're informed, they're not— they know, you you know, they have deeper understanding. This Bitcoin is going to be worth a lot. I mean, even the country of Iran, they're accepting Bitcoin, let ships through the strait. Bitcoin is where this thing is going. And it's just gonna be like Michael Saylor used to say, it's like owning a, a block in Manhattan 300 years ago. It's gonna go up in value and you're gonna be happy you got it early than late.
Yeah, absolutely. Um, okay. And, um, Giovanni, I actually like this idea. I, I want to find more ideas like this. Um, in fact, I think options is something that many people should learn how to do. It sounds scary because it's all option, right? It's complicated.
That's like me, that's exactly what I do.
This Marcus guy, yeah, it sounds like a German name.
Yeah, I do asset-secured puts. That's what I do. Yeah, that, that strategy.
It's actually— I like this idea. I need to— I have actually downloaded recently some option data, and we can do backtesting and testing different ideas. Um, yeah, if you come to our community, you know, in our Discord channel, we have an entire channel where we discuss ideas like these. Um, but yeah, people should explore because first of all, it's general education. You learn about what an option is, you know. It's a— if you are investing in Bitcoin, you are an investor, so it's actually good to know what the derivatives are, what futures are, what options are. Just learn about it. Then one of the best ways to learn is to play things. I like, I like when I code, for example, or now, right now, when everybody's learning AI, I like to play with it, you know. And if you play with options Don't, don't spend hundreds of thousands of dollars. Do it with, you know, for example, on Robinhood. You cannot— I don't know if in your, in your country you have Robinhood, but I'm sure there is an equivalent. With Robinhood, you can buy a fraction of a stock, right? Okay, with, with iBit, for example, you will need to have 100 shares to play with the option, right?
Um, but they're like $39, right? You can get 100.
Yeah, so it's few thousand dollars. That is not the end of the world, and you can play with it. You can learn how to do, uh, covered calls. And I have several videos where I explain how to do covered calls, um, with, with iBit, for example. And, uh, and you learn, you know, you learn in this way without risking a lot of money. It's nothing much better than buying meme coins or sports like that, you know.
That's the power of having the asset. It allows you to sell those out-of-the-money options. But yeah, Marcus.
Yeah, and I am often in Lugano. I will be more often there, different activities, etc. I don't know if you know about Marcus, Marcus with the K. I don't know where in Switzerland you are, but in Lugano there is a very nice Bitcoin hub where people meet and We are creating an institute, it's called the Scientific Bitcoin Institute, and our main location will be in Torino. It is not far from Lugano, but we are going to have also an office in Lugano, in Switzerland. So if you ever come to Lugano, coordinate with me, send me a DM on X, and maybe we can meet in person if you like. We can have a coffee or something. Okay guys, thank you so much for all the very good questions and, you know, to be with us. Uh, this, uh, for me is like late evening. I imagine Marcus, you are in Houston?
Yeah, Texas.
Yeah, it's, uh, later, later. Yeah, okay. I don't know what time is in Europe, but thank you so much guys, and we will see you, uh, I don't know if we are going to have a show, uh, but we could have a show there, at least for 15 minutes. Yeah, live. Maybe we have a short show and we tell you, hi from Las Vegas.
Yeah.
Okay, see you guys. All right, see you. Bye, everybody.










