Bitcoin Live with the Power Law & Minotaur Team, #4, 4/3/2025
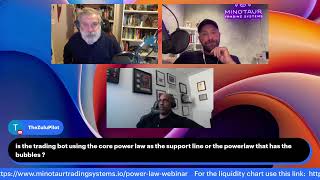
Live YouTube panel (April 3, 2025) with Giovanni, Kosta Ouzas and Marcus discussing Bitcoin price dynamics, the Power Law model, and Minotaur/Manotar trading systems. They announce an in-person event (Venetian, Las Vegas, May 27–29; closing-night presentation May 29), explain a power-law fit where Giovanni claims price follows time^6 on his model and a persistent gray support line tied to Bitcoin production cost, and analyze liquidity-driven mechanics (Derivatives/liquidity heatmap, harvesting of leverage pools). Key operational points: liquidity-price delay ~70–100 days, the trading system uses the power-law support as a risk/reference level (protect positions and size safety orders), and the team projects a potential peak region near $200k while noting shorter-term critical periods (next month) and a nearer-term fair-value/ liquidity-implied level around ~$50k (Giovanni's liquidity→price model).
Questions this video answers
Venetian, Las Vegas — May 27 to May 29 (closing-night presentation on May 29; doors open at 4:00).
He described the model as price scaling roughly with time to the power of six (time^6).
They cited a projected peak near $200,000 (discussed as a calculated target, not certain).
About 70 to 100 days (delay between liquidity changes and Bitcoin price response).
Around $50,000 (liquidity-implied fair value from Giovanni's model).
Chapters
Okay. Hi everybody, we are live. Sorry we had some technical difficulties. Marcus is going to join soon. He has some problem with the camera, but, you know, hopefully fix that. So I am here with Costa is the CEO of Manotar Systems Trading Systems. That is the company I've been worked for with for some time. We develop trading system that has the power law as one of its fundamental principles. And you know, we will discuss that in a moment in more detail. But basically the nature of the show is that we work as a team, so we have different approaches, different ways of thinking about the market. And we were going to discuss, discuss recent price action using the power law indicators like I usually do. And then Marcus is very good, so I hope he joined us soon. Yeah, because he was restarting his computer because he's a Wall street experience trader. Uh, and he has a lot of, uh, experience, you know, since uh, long time ago before, you know, people use actually computers to trade. But he has a very good. Yeah, final. Hey, Marcus, welcome.
Hey, there you are.
We can see you. You know, he's very good skill in understanding how liquidity works. And so I really enjoy his presentation about these topics. Okay, so I, I can start, I can be. I can show some of my indicators and see, you know, we can see what is going on. Let's start from these. So it's, it's one of these indicator where I basically show the different cycles, how the different cycle compare. Just give me a second. Well, let's, let's start from the usual chart. Okay.
We can also discuss the event in Vegas that we've organized.
Yeah, let's, let's start with that while I'm preparing my chart. Go ahead please.
Yeah. Oh, if I can share the screen.
Yes, let me authorize it.
Okay.
Yeah, go ahead please.
Yeah, so we, we flew out to Nashville last year. We're one of the sponsors of the Bitcoin conference, which was a great event. A lot of big names spoke there and we had the privilege of meeting a lot of past clients, also a lot of future clients. And it was also a great place for people to actually meet us in person, you know, shake our hands, talk to us one on one. We had really, really good time. And we're all set to be in actually a larger sponsored booth in Vegas. I think they're expecting 45, 000 people to be attending the event at the Venetian, I think from the 27th to the 29th of May. So it's a, it's a, it's a huge event. Giovanni's going to be there. We're all going to be there. You know, Trump spoke there last year, Michael Saylor, I know they've got a few big names. They're already. This year I've been speaking to them. They, they will be announcing some, some bigger names, they think potentially as well, last minute, which is kind of what they do to build up that excitement for the event. But one of the cool things that we've decided to do this year and the. The actual event in Nashville was really interesting because that's where we met Giovani first time in person. So we, it was around then that we'd actually organized the time to start to discuss things with Giovanni and he actually showed up to our booth and we started talking and that's really where our relationship really took off. It was very soon after that that he started running our algorithms and he's been running them since then. And obviously in the last few months we've been working a lot closer. But the Power Law was a huge part of the, I guess, the fundamentals of our system. In a way, it was the missing piece that we needed. It's not having the risk management that the Power Law provides us with. It was a real game changer and we really want to be able to present ourselves together at the conference and it's really hard to do talking to people one on one. So what we decided to do was to actually get a huge space and to do a big event where we can invite a lot of people to come and to listen to us all together and do a really cool presentation and going to be food and drinks provided. I think it's going to be one of the bigger events that happens at the conference and we're going to be doing it on closing night. So on the 29th of May, it's going to be level four in the Venetian. So I think the event closes around 4:35 and this is going to doors open at 4:00'.
Clock.
So this will be the kind of the closing party. You're going to hear Giovanni and myself and the rest of the team, like Mark speaking there. It is going to be invitation only because there are going to be limited positions, places available due to capacity. So if you're interested in joining the event, just come and see us at our booth and we'll make sure that you can get access to an invitation look like this and you can present it to us at the doors and you get yourself in. So, yeah, we will keep reminding everyone about that, but it's coming up in the next Sort of less than two months now. So we're super excited about that event and I know if you guys want to add anything, Mark is going to be there. He's going to be talking on stage as well. Of course Giovanni will take up the majority of the time to discuss the power law.
Yeah, I think you're on. You forgot to be have a food and drinks if you come to the event.
Yes, we are going to do so. Yeah, it's going to be a kind of closing part. It's going to be a closing lecture party we'll call it.
Yes.
So yeah, I think it's going to be really fun.
I'm very excited. So everybody please come to visit us. You know, contact us if you want, want to invite, you know, DM me or DM Costa, you know, if you are interested in coming to the event. We, we already have a list but we have some places that you know, if you're really motivated we can, yeah, come, yeah, yeah, come to talk to us or DM me before. So we can send you an invite. Right. But it will be a great opportunity to meet all the people that are interested in the power law or the trading system or boat, you know. So it will be very exciting, a very useful meeting, very productive meeting. Okay, so I'm ready to share my, my graphs and we will discuss and by the way, if you guys are interested, if you're interested in the indicators I will post a link on my x and on YouTube. It's basically a Patreon subscription. Right now we have a 13 of these indicators and almost up every month, a month and a half, I produce a new one and we are adding all the time new information. But this is a four of them that you see on the screen. They are attempting to describe what is going on with Bitcoin both in terms of a long term trajectory, but also the cycles. Now you know this, the cycles in the past have been very, very regular and the entire idea is that if these irregularities continue to exist we will see similar patterns in the future. I, I'm going to show you using these indicators but others in the list, in our 13 different indicator list, but this cycle seems different and that is mostly I think because of this tariff situation that is really confusing the markets. Right. It's great. It's like a something that is, it could not have been predicted. Bitcoin is reacting I think actually pretty well to it. But it's, it's a disruptor, you know, in terms of how the market in general could have behaved without this, you know, very impactful events. But okay, so in this graph you see right to a general idea that bitcoin follows a power law. Basically the power law is the white line. If you plot it up for all the people that are familiar with the power law, if you plot it in a log log graph where you take the log of the price and the log of the time, it looks like a straight line. Unfortunately, Trading view doesn't have a way of taking the log of time. And so the curve is going to be, instead of being a straight line is going to curve. Right. A straight line in a graph like this, where I take the log of a price in the keeper time, linear will, will be an exponential. And obviously bitcoin is not an exponential exactly, because it follows this curve. But you know, it's an equation. It's an equation of. It says that bitcoin price goes up in time with the time to the power of six. That is an incredible high power.
Right.
When people say oh, the price went parabolic, we mean parabola. And the parabola is square, right? This is to the six. It's like a parabola. If I do it in a linear graph and they can show you. Right. And, and most people are familiar with this, but this is just a reminder. So Trading view has the ability to take the log of X of, sorry of Y, not X. And if I take it off, this is how it looks like. Right. So it looks like a parabolic type of motion, but instead of being like with a square, it's with the six. So much faster than a parabola. This is what the power law is all about. It's a super parabola type of behavior. So over the long term you can see it follows. Very good. Right. There are deviations from it, but in average it follows the power law very well. We did many tests. It's not just a regression line. It's a really a statistical deep behavior of Bitcoin. In average, the slope of the changes in Bitcoin follows the power law. When you take the log, it looks curved like this. It looks curved like this because anything that is not exponential will look like it's losing ground relatively to an exponential. If I take now the log of time, it will look like a straight line. And it's very impressive straight down. I, I have actually there is a workaround to show that Bitcoin is a straight line using Trading View, but you have to create a doc chart where you create the x axis. You see, this is how it looks like if you, if you Create like an artificial axis in trading view where you take a log of that, then you can make it look like a straight line. It's an impressive straight line. Now in fact, it's so impressive straight line that if anything we are following too well. Right now. We are too well too much on the power law when actually the only time where it really strongly deviates from the power law is during these bubbles. You see, and these are sine waves here. These oscillations are meant to indicate that these oscillations are very consistent in time. They are very periodic. And we are expecting to see a similar peak even this time. Now is it going to happen? That is a big question, right? Is this local disruption that we see right now temporary? Do we go back to a bull market? Maybe after the market has processed this idea? Because mostly what markets hate is uncertainty. But now we know what is going on with the tariff. So on a certain point, I think the market and you know, I want to see what caused by Marco's opinion. So this is. But maybe the market will already press in these new world in which we live with all these crazy tariffs. And that will not affect Bitcoin over the long period of time. So there is still a chance for the bull market to continue to reach our target. We predicted a 200k target, but you know, that is not 100 certain. We will have to see. We will have to see if that is actually what is going to happen. And this is what this chart is trying to do, is trying to project where we are supposed to have the top. It's there. The reason why it's 200k is because you see, if you look at this channel, these are orange channel. This is not something that I drew by hand because nothing in this chart is through band. It's all done by calculation. This is what distinguish us from any other, you know, method that uses ta. We are using real physics here, math. And so there is a. A very precise decay that is observed from the peaks. And the idea is if that decay is true, and yesterday in our physics Bitcoin episode, we actually, Stephen Perov, it is also a physicist, he analyzed this decay and he also showed using a completely different method that PET decay is a real behavior of Bitcoin. So if that decay continues to be true, then we can calculate based on the speed of a decay basically on this channel, this orange channel, or some other similar method that the peak is going to be here. This is how we project the peak. You see, it's a. At the 200k because of that, because of this upper channel, are we going there? That is a big question right out of a tariff so disruptive that basically the cycle is dead. And. But you know, right now, what I always say when people ask this question is that it's too early to tell, right. I think by the. By June, if we don't see a recovery, then it's probably worrisome. We are still on the power law, you know, so the only thing that changes is do we still see these huge big bubbles where maybe we can take advantage of the volatility? Maybe, you know, if there are ways like this, right? If the cycle continue, there are, there is some level of predictability where we can use to change, you know, to maybe resize our portfolio to open some put trades, right? Using options and using this huge volatility and the fat when there is a recovery to actually multiply or bitcoin.
Because.
Because that is one of the angle that we take as a group here, that there are things that we can do actively to actually get more bitcoin. BCA is great, Odling is great, but there is certain things you can do so you can get more bitcoin if you study, if you are understanding, if you focus on the market. The other important feature of this chart is that is also relevant for the rest of the discussion is this gray line. This gray line is what we call the support, the bitcoin support and notice how powerful is in getting all the different bottoms of the history, right? So this is what actually the trading system that Costa and his team is developing is using as its foundation. Because you see, it's something that is not due to by chance. In fact, we have discovered through our studies that is linked to the cost of production of bitcoin. This is why it works. It's not just a line that somebody drew by hand. It's not accidental. It's real. And it's based on physics. It's based on the cost of production, on how much electricity cost to produce bitcoin. And that is our point of reference. These were actually the power law cuts. Is. It's one of these, one of the reasons why we see a power law at all, because there are physical constraints in how bitcoin behaves. You see, this is Covid, for example. Even during COVID we barely touch that gray line and then we bounce back almost like if it was a wall. So here again, you know, these are bottoms. It's not. It's not chance. Look at this. It's one of the most spectacular Things about Bitcoin and it's amazing that we have a trading system that uses this. These are some of the things that we can observe from this chart. Yes, go ahead.
Yeah, I wanted to add to that. So you know we're focusing a lot on the cycles. Will the cycle happen? Will it not? Is the price going to go up? Is it not? What's really cool, and you can vouch for this Giovanni, is our trading system is going to generate returns from Bitcoin no matter what. If it stays above that support line. If it doesn't matter if we have the, if it doesn't matter if we have a new all time high, we can, we can crash back down to that line. We can stay in a sideways market for the next 12 months. We can have a little bit of a correct. It doesn't really matter. The system is generating steady returns no matter what the price action does as long as we're staying above that line, which is again where we protect the position if we ever need to. But it's happy days as long as we're above that line no matter what it's doing. So if you're someone who's sitting there who's kind of anxious because they're worried about the price going up or down because you're all in on a huddle, well this allows you to actually generate returns no matter what the market decides to do.
Yeah, exactly. Now you know, even. And that is actually makes the system even more relevant because if you don't have a cycle, you know that is one of the things that many people attack me etc. But they never understood my position. My position is we are all, all we are not against Hodling and we love bitcoin. We consider a long term investment. One of the reasons I work with Minotaur, that if they are exclusively focused on bitcoin I will never have work with a group that does all the type of trading etc or shit coins etc. I'm not interested in that. But this company is all about you know, getting more bitcoins because you know you are, we are not anymore in 2012 or 11 or 10 when buying Bitcoin, you know, for a few dollars. We love set up for life. Now it's not possible to do that, you know, unless you are already a millionaire and you buy millions worth of bitcoin. If you are a normal investors it's, you know that door is kind of closed. Bitcoin is still amazing. You know the power law tell us we can go to 10 millions in 20 years from now. It's one of the few things that Russian they actually tell us that is an achievable goal. But you know, it's going to be more and more expensive to buy. It's going to be less returns because of the power law predicts less and less returns. Still amazing, you know, under pair. But what about if you add also a little bit more aggressive approach with a portion of your holdings, right? You don't have to do it with more than 10, for example, or 20. You take a portion of your holding, you take and you are a little bit more aggressive. You learn how to trade maybe using options or maybe using a system like ours and you can multiply in this way your bitcoin and have them. And you know, wherever you get your gains are through this trading system. You can buy more Bitcoin. That is the idea. And if we don't have these cycles, that was another way of leveraging the volatility of bitcoin. The trading system becomes more relevant. So. Yeah, exactly. But you know, the, the power of a trading system lay lies. And you know, when CASA will describe a little bit more how it works lies in this very powerful, you know, point of reference for us with this, this gray line. Now these other indicators show the regularity of a cycles. You know, we almost use a like a clock analogy. 12, 3, 6 and so on. They describe all the different times. 12 is the top, 3 is the bottom. Right now we are ready transition to the full bull market. That happened at the end of the last year. You know, this was the price that we had at that particular time. I even predicted early on with around November we were supposed to go above the power low. Then we went down. That going down the power law has almost never happened. Once we are in, in a bull market. There is, you can see actually from this indicator, this indicator shows the difference between the power law and you know, and the price. So when he's red like this, it's usually when, not usually, but yeah, most of the time is during the bull runs. Right now there are some little fake outs that happen in these periods where we are supposed to be below the power law. But usually there is a correction that brings you back to the power law region. We call it a bimodal. Basically we say that bitcoin has two modes. One where we stay in this green area and one when we stay in this area associated with the poor runs. It happened one time where we kind of broke. We had this pattern you see here where we went below the power law. But then we had a very, very fast recovery. It was much faster. This is just a Little Deep Venue 1 we have right now. We, we are staying below the power law for an extent of period of time. And this never happened in the history of bitcoin. Now you know it, it doesn't mean that we don't have a cycle, right? It's still an open question. This other indicator here shows is, is called our earth coefficient. It shows basically the regime we are in. If you are below this orange line, it's a mean return situation. Usually this is associated with that when we are below the power law. When we are above it's usually associated with the bur. So we are still in a bull run even from a hers coefficient point of view. In that case it's trend following it still tell us we are not, we have not broken these trend of going up. It's still there right now if this curve goes below 0.5 then it's a different factor. The last indicator I want to show before letting the, you know, the rest of the team discuss their particular point of view is this indicator. So actually two indicators. One is the global liquidity indicator. The liquidity is still going up. Now I have also an indicator but maybe I will show you at the end that discuss uses the liquidity, the global liquidity in particular. It's mostly M2 in this case. I, I don't have any delay between the two. They are superimposed. You know, I transform liquidity into a price using a model of a relationship between Bitcoin and liquidity. So this is kind of a fair value of, of bitcoin based on global liquidity alone. That price right now it's around $50,000. So we are still overvalued. We don't have all the liquidity that we need. But also another interpretation of this graphic. There is a delay between the liquidity.
And.
And the price. And if you use that liquidity then basically, I mean if use that delay then this branch up is what is supposed to happen to Bitcoin. So Bitcoin is supposed to follow the liquidity after a given delay. That delay is about anything between 70 to 100 days. And right now we are coming close to the lower limit of that range of possible delays. It's basically we are supposed to go up in the next week or so. And if within a month it doesn't happen that we actually follow this branch up, then you know, in general, yes, there is a very strong relationship between global liquidity and the price. But Maybe we don't always follow all the different little features. I hope so. Right. Because it will be a nice run up if that is the case. Okay, one more thing and then I'm really done. I want to show you this graph that shows if I find it, there are many graphs. Open. This one. So this one shows. It's a kind of overview of all the different cycles. So I'm basically superimposing the cycles. The 3 difference. You know, there is a fourth one for some reason I'm not showing here, but you still see it in the chart. But basically this is a previous cycle. So every time you go lower you see exactly what happened at the same time in a previous cycle. So this is the current cycle. You see how we are going below the power law. These were last cycles we were, you know, we had an early run up, you know, because we had a kind of a double top. We had a, a top in mid April last year. So we were pretty aggressive during this time. Right. Where are we are kind of flat. Then we went down and even in the cycle before that the bull run started to feel itself because we are supposed to actually go pretty fast time now we started from a lower point. So at this time two cycles ago, we didn't even cross the power load yet. So this is why this cycle could be a mix between the two. We, we started early in a very aggressive way then but you know, maybe it was too early mostly because of the ETFs. We were kind of already high relatively to the power law. We will push up early and then, you know, the tariffs and other things happen. They kind of stop a little bit that way. Right. That could be an interpretation. We will have to see which one holds.
And.
And so maybe it's a mix between the two. Where we started early, then we stop and. And now we are going to recover later. You know, that is, you know, the most awful type of interpretation. And if you think it in that way, right. If we didn't see this run up early on, you will still think that maybe there is a comparison with this particular cycle. Right. So we will have to see. It's interesting to compare with this different cycle to see what is similar, what is different between the. The three of them, you know. So this is the last slide I wanted to show and maybe Marcus can talk about or maybe guys, if you have any questions or comments about this chart and then we can look at Marcus local liquidity charts.
Very good.
Do you guys have any comment or anything you want to add or.
Yeah, I'll. I'll add to your. When you were speaking on the liquidity. Yeah, you know, I'm a big fan of liquidity. I think the tariffs are not. Yes, the tariffs have been an unexpected, uncertain impact to market conditions on a very localized basis. Right. However, they could wind up being a very beneficial event because the tariff could be setting the groundwork to give the Federal Reserve the actual data that they need to start easing monetary policy. Right. So we can get that M2 and we can get that liquidity into the system. They need a catalyst or a trigger to show that it's not overheating. So these tariffs could be the. The actual shock that they need to fire the trigger on the easing monetary easing. So that easing is necessary for us to reach that final phase. That's why we're on. We're delayed. We need that liquidity from the federal.
Yeah, that is a very good analysis. Possible that, you know, we needed that kind of reset. If you look at one thing that it's interesting, right. If you look at the last cycle, what happened is that we went. There was some kind of event. I think it was associated with this, you know, kind of a scam in China that created like a momentary kind of. I always say there is no supply shock in Bitcoin, but in that case, there was some kind of shock in the system that pushed the price up because actually a lot of coins all of a sudden were locked into this scam. There are very strong. I investigated this. I think it's actually exactly what happened. But whatever happened, the price went above the power law. We were not supposed to be there. It was a correction. But Covid then created even a stronger reset. Almost like we went back where we were supposed to be to the bottom of a power low. And then basically, almost like a spring, you know, we compress it and then the bull run could start after that. We had a similar situation because of the ETFs, where the price was push up higher than it was supposed to be. Like it kind of inside this green area. We arrived. Look at this. We arrived at the power low. The price was rejected. Exactly. This time didn't even go too much above the power load. Just stop there. Then we had a correction, but the correction was not big enough. In particular, the correction also was not followed by global liquidity going up. And it's something that I reported for a long time and say something looks weird, you know, because usually we have liquidity at this time of year. And we did it. And then we did have a Burundi also because of a Trump selection, etc, etc. But it was not enough. It was not enough to. Because we were already kind of high. And we need global liquidity really to create these bubbles. Right now in general, Bitcoin is going to do his own thing over the long period of time. Liquidity is growing, you know, and that is how Bitcoin also grows because it does need money moving from one place to another. Right. And right now we need, it's not just individual investor, we need also institutional investment in Bitcoin and it's going to happen because more and more money finds its way to Bitcoin. But in terms of the bubble itself, we need that liquidity to come in. And I like what Marcus is saying because probably maybe this is what we needed in terms of resetting things. And I don't know if we need to go even lower than this. But you see we are approaching actually that pink line that roughly tell us, you know, where we are supposed to be. This was a normal burn. So if there is a continuation, a lot of things are seem to converge. Right. Liquidity is growing. The market is processing the news associated with the tariff. So I think they are going to have less and less of an impact and hopefully this correspondence between global liquidity. Right. This delay is a real thing and you will see a run up. But okay, you know, in the next few. I think the next month is going to be critical. You know, we will see what happens after the end of the month we can reconsider and see what happens. But right now it looks like we're ready for some kind of recovery and continuation of a bull run. Okay, I will, I would. Yeah, go ahead.
Yeah, it's, it, you know, when you look at it like this and it's, it's really not that concerning. I think, I think the news that happened yesterday with the tariffs and the way the stock market plunged, especially the Magnificent seven. Bitcoin hasn't done much, it hasn't moved much. It looks like it's really already corrected more than it's going to. And we're talking that, you know, how long ago? 12 months ago. What was the price? 40k, 50k. You know, we hit 100 608, we're back down to 82. You know, I think everyone's got short term memories. I think that if the liquidity comes in like we're saying it should. I, I'm. Well, we've discussed this personally with our team and we can't see it not getting to at least 130138. Marcus can give us an example of why if we can get to 138, we've still got 12 months to get the rest of the way. I think anywhere between 180 to 220 is going to be possible and then I think everyone needs to buckle up after that because I think that power support is going to pull it down like a magnet. And I think that Giovani is one of the best analysts and one of the best and most realistic people that you should be listening to. If things do start getting to the top of that cycle and I again just be aware that it's going to be, the narrative will be completely shifted. It's going to go back to like it was two months ago. Every talk, everyone talking about God candles and super cycles and the price never going down again. But I think it's, I think this correction right now is going to seem like nothing to the correction that will come if we get to those extremely high prices of 200, 220. And the reality is most people are probably going to ride it all the way back down. That's what always happens. So you know, stay tuned the next sort of 10 months or so because I think this is the best place to get the best information about the cycle. No one can predict. I know one of the guys in the comments is saying, you know, predict the price. It's not about predicting the price, it's about having a roadmap. The roadmap gives you just more clarity. Even if the price range is between right now 40k and 200k, it's still a better roadmap than zero to infinity. And if people can't say that, having that is a huge, huge piece of knowledge that you can really do a lot with. You know, no one can help you if you can't see that, but we can and we built our system around that because, you know, we think that this is the best, the best content available, especially for bitcoin.
Exactly. So very, very good comments because first of all, predicting a price, right? That is ridiculous because yes, we can predict the price. I did. I told you I found that method. But when method and the logic and the pattern is what really is relevant and important, right? Why? Because you are starting to think about Hobie Coin Works and you can adapt to all the different changes, right? Okay. These happens and these other. This is a connection between liquidity and the price. So you know, the different phases of the market, etc, that is much more fundamental than predicting a price. I didn't know price you can guess, surprise. You can try to use prophecies. You know, this is not what we do. We're trying to use logic, rationality, and we are trying to avoid fomo, you know, because fomo. I don't know why people get excited about that. I. I don't. Because it's always a disappointment if you're thinking that, you know, we are going to a million in few months and then it doesn't happen. I don't know what people get excited about it beside, you know, having some fun when things are boring memes and things like that. Anyway, so let me close my presentation and Marcus, if you want to share your liquidity chart.
All right.
And by the way, Marcus works with the company that produces this very beautiful liquidity charts. And I posted a link. We'll also have it on YouTube. YouTube and on X, it's a sponsor link. So if you want to get the same charts that Marcus is using, please use this link that we are showing. It's both in the. At the bottom of this presentation. I think I should see them.
Okay. All right. Just to get started here, I wanted to start off the liquidity presentation by just looking at a standard retail trading chart that anybody would see on any given day. This is Bitcoin. And the. The key to it is what is the story behind the black zones that you can't see what's going on? What makes the price move in the directions that it moves? And we all know the answer is liquidity. But it's one thing to talk about liquidity as this, the Easter Bunny, or it's some type of thing in the ethereum, but it's another thing to actually understand and visually see where it actually is. So, for example, I'm just going to take my marker here. This is bitcoin. It's a date, time frame. There was something that made this price shoot up there. What was the driver? What feel that explosive move and then conversely, what fuel the explosive move down. So we can clearly see that on a very basic chart with nothing on it, no indicators, no magic, no smoke and mirrors, that something is fueling the price. And we can see that there is a resistance point here, and we can see that there's support here and support here that was broken here on this move down. So we know something is going on. So let's take a look at what's actually going on behind the scenes. So without further ado, this is what's going on behind the scenes of that price move. That price action. So really quickly, we like to use the derivatives market because price discovery typically happens in derivatives markets first because you have leverage and leverage is magnified. And anytime you have basically unlimited leverage, things are going to implode and move much faster than where there is low leverage or no leverage. So in the spot market you're one to one. And then the derivatives market in crypto you can go 125, 150, 100x. So you're going to get price discovery there first. And if price discovery deviates too far in one direction, then the spot market will correct by hedging on one and shorting another and buying and covering and things of that nature. So really quick, once again thank would like to thank Giovanni for allowing us to present with him. Co present tonight. I also want to give a shout out to the team of trading differently who are the creators of this particular technology here. And so what we're looking at here is this is a perpetual futures market, this is a derivatives market on the exchange by bit. All the exchanges pretty much have the same function. So this is by bit, we're looking at the day and we are looking at some liquidity, right? So if you remember that same scene, there was a tremendous amount of liquidity that fuel that first impulse up that took place in November, coming out of the summer of 2024. So that was that breakout, it was the harvesting or liquidation of a tremendous amount of liquidity that had built up. So then once we got past November, we entered it, we, we reached a high of about 108. And then we've been in a trading range that was our high. So we've been consolidating since then. So what happens is when the market breaks out, it enters into a new range and it stays in that range while it builds up new liquidity. That's what it was doing. So we're building up new liquidity. And just to be clear, what you're looking at here, these are not, this is not a order book heat map where you see limit orders and things of that nature. This is actual positions that have been opened up and these are the liquidation levels of those positions with some stop losses mixed in too. So we have on this particular display you're looking at a composition of 25x, 10x and 5x. Don't really need to look at the 3x because that's almost close to 1 to 1. But so we'll just focus on the 5 to 25x. So the composition of these positions are 25x leverage traders all the way down to 5x leverage traders that have been aggregated. So when the market moves into a new range, it starts. That's the reason it chops, it gets in this range and it slowly builds liquidity over time. And then once the liquidity becomes sufficient as it is here, as the liquidity gets larger, then it breaks out and the breakout is really just the harvesting of all that liquidity. That's what's going on here. So when you think about it from an institutional level, the retailers do not move the market. It's the whales which are, that feed on all of the small positions. And it's the whales that have the financial capability to make large price moves and they tend to trade on larger time frames. That's why these cycles take a long time to play out. The market is fractal. And so what we're currently in that this drawdown here is we are harvesting the long side liquidity that had been building up since November when we broke out from the summer. So that's what we're doing. We're harvesting that now. It's not just one firm. There are literally thousands of institutions and hundreds of thousands of algorithms all working, doing their own individual things. But if you think about it in aggregate, they're doing very similar things. And the similarity of all of those individual trading desk institutions and algorithms tend to create one pattern. So that's what's happening here. Because there's a, there's a misnomer where people think there's just one or two firms that are controlling this or one person pushing buttons. No, it's a lot of firms. Some have more money, like for example, blackrock, Aladdin, they have a lot of capital, but in aggregate, they kind of doing the same thing, same game. So, so we are currently in this lower range here, this little local range, and we've been here since February and we've taken about 75% of this particular pool, which is compared to, which is composed of 5, 10 and 25x this pool. So there's a little bit left. However, what we've been doing local lately, we kind of have this bear pattern working here. We have a kind of a bullish one as well, but we've kind of level, we're starting to level it off the longer we stay in this area without coming back down because we can potentially finish this pool, but it's not an automatic thing. So the market could start to turn up here because we do have some isolated liquidity here. This is new stuff that's starting to build here that could Give us the fuel. Because the market, if you think of it from a markets make its perspective right. They need liquidity to move the price. If you move liquidity in areas where there's low liquidity, if you move the price in areas of low liquidity, you're going to be adding a lot of risk to your, to your, to your book. So if the liquidity is relatively close, it acts kind of like a conduit to start turning the market. The market is magnetically attract, attracted to all that captured liquidity. So at some point we, we, once we complete the harvesting of the loans, then if you think about it, these are forced sellers, so they're selling low. And all these trapped positions here that are up here, these are forced buyers. So they would be buying high. And if you think about that makes no sense, but that's what's happening. If your institution, you're taking, you're harvesting this liquidity low and then you carry it up here and you distribute it at a higher price and then the market creates another range and it just continues up and down. But one solid piece of indication is if we were going to go into a bear market now, the, the logical move would have been to come take liquidity to the short side first, then carry it down here, right? So it's a good sign that we actually took the long first because now you have this inventory that you've harvested and you need to take it somewhere. If you continue to keep taking it down, then you're going to carry that inventory down. Would make a lot of, that's not very intelligent from a very basic standpoint. So you would, it would stand to reason that you're going to bring that liquidity up here. And so now when we look at what up here means, if I can put the 3x because typically in bull markets when it's moving very fast, you actually liquidate the 3x as well. So we, when we add in the 3x, we're at about 137 and by the time it gets up here, there'll be new liquidity also starting to grow as well. But we can at least reasonably have a reasonable probability that we're going to get at least in this, the meat of this liquidity, which is about 125 to 1, you know, somewhere around 140. So I would say that's a high probability. And the power law says that's about 80 days before we start chipping at this. And the liquidity map actually says the same thing. So, so we can, you know, reasonably Assure that we are going to come back up at some point.
So is, do you see any convergence between, you know, what I discuss about the global liquidity? That is, it seems that basically the next month is going to be critical. Right. In terms of seeing this leg up. Right. And maybe a recovery, recovery of a bull market. Do you see any indirect sign of a convergence between what they discuss and you see?
Yeah, I think it's funny when you start talking about news events, you have short term news, which is like predicting short term weather. You know, it's funny how the news and actual price action wind up agreeing whether they. It doesn't seem like it. Right. So there's a operation going on here that is irrespective of news, you know, it's harvesting of liquidity and then there's creation of liquidity. Right. There's chicken and egg. Price action creates liquidity and liquidity attracts price action. So they're one and the same. Right. So regardless of what the news is doing, price action is creating liquidity and harvesting liquidity all the time. However, I am firm believer that even if you were a big institution from a macro scale, tariffs and other types of news events will affect you over 12 months, 18 months, 24 months. Monetary policy. The Fed is not looking at what's happening date on these day bars. You know, they're looking out 18, 24 months, 36 months as well. So I believe news has more of a macro effect, just like in physics. Right. Or weather. We do, it does matter for winter, summer, spring and fall. Right. The, the seasons. Right. Those are longer term events. So I believe that the news definitely impacts the longer term trends and the longer term strategies that the big institutions are doing. And the tariffs will play out probably over the next 18 months or 24 months. But the market, as you were saying earlier, doesn't like uncertainty. So they price things in now in anticipation of the future. So. So that's my two cents on that.
Yeah, I wanted to add to that the way that we kind of look at the liquidity heat map, especially when you start to see the green, the yellow and the red is a concentration of contracts that actually open. So I think you could almost argue, Giovanni and Marcus, correct me if I'm wrong in my interpretation of this, is that regardless of what the global liquidity does, this is existing liquidity that's already in play, that is set to basically cascade at least up to those prices because this liquidity has already been deployed. Right. These contracts are open, they exist. So what I think we're Looking at is, of course, the global liquidity. If it increases, that's really going to affect that. When we do take out that top pool of liquidity, how the next two pools of liquidity start to fluctuate form, is there going to be any liquidity left to create both liquidity pools above and below? Right. So that's kind of the way that, that I sort of interpret it. What do you think, Marcus, on that? Like, you know, these contracts are there to be taken out regardless of what happens. Right? That's what we're looking at.
Yeah, I agree. Like, when we get up here and we start taking this and everybody's going to say, oh, it's the market's moving liquidity, it was already there. Like you said, there's an operation going on that has nothing. That's irrespective of the news. And you're right. When we get up here, this, this, this is fairly assured right here because that's trapped, it's caught. That's bagged and tagged. Right. But when we get up here, what's going to happen when the new range is formed? Right now you bring up a good point. The market is not certain to keep. If it takes out this upper liquidity, then it's going to reconsolidate to start a new pattern like it did here. Let's just look at the history right here, right now. If the bull market will probably cease, then this is a good time to take it back down here. You don't want to keep building it up if you're not going to continue. So when we get up to this new range, let's just assume this is 130 and we're in that new range. We're going to 150, 200 or whatever. Well, the, the path to getting there will start to look like this because you got to have new liquidity. Like you just said, when we get up to this next level, it's not there yet. So if we are going to get to 200, we'd have to build some new liquidity. If not, you'll see the market tap it and then it's going to turn.
This liquidity coming in now, I think is what's going to be forming the top, like we said. So, so yeah, this, this to us, the way we look at this heat map is, is almost like it's bagged and tagged. Right? Like it's there.
This is in the, this is in the what? The what? I'm from the south, so this is in the kit. This is in the Oven. That's, that's in the, on the grill. Yeah, that's on the grill.
What do you think, Giovanni?
But the big question is, what's going to happen when we get up here when we take this and then we create a new range? What's the new stuff going to look like?
Yeah. So I, I really love these discussions by Marcus because independently from, you know, understanding, first of all, he was right.
Right.
He did say last time, last week, I remember very well, that we were going to have some kind of correction. This is what he was in the oven like. He says, I love his analogies. I, I believed in the south, by the way, in Louisiana. It was one of my best experiences so far in the United States. I love it more than California, for example. I love his sound. But people are real there, you know. Anyway. Yeah. When you started to explain me this concept, it's not that I was not aware, completely aware of them, but your explanation makes so much sense, Right. It's the market is this battle, right, between people that want to buy. People want to sell bears and bulls, right. And it's a continuous dance, right. And you cannot have one without the other. So you need to kind of load the car full of supply before you go to a road trip.
Right.
You need to do that. And this is what happens with this liquidity chart. Right. Basically every time somebody sells somebody's buy and they are buying in particular during these times where everybody sells, who is buying? The season traders, the traders that understand the market, they want to buy cheap. Many times they actually influence the market. They push it even further down so we can, can buy cheap. And why they buy cheap because we want to sell high. So the same way that they push the market down, they are going to push the market up. And this is going to happen over and over again. So it's important to start to think more like a seasoned trader instead of following the formal. This is why I never like the former. Because FOMO makes you do exactly the opposite of what this season traders want to do. That is you buy I and you, you sell low. You know, this is what most of the inexperienced traders want to do. Yeah. And you want to learn to do the opposite. And this is what, why we do these shows. We are trying to make you think about these things. They are trying to teach sharing because we are learning at the same time with you. It's a sharing experience. It's not that we know much more than you. We are just trying to use this tool, use rationality. We do have some Experience but you know, it's a learning process for all of us. And, and this is a very good approach. Right. Rather than showing you some TA charts, etc. I saw some trolls comments about the, you know, the stupid things that they call it a power opinion. It's not an opinion at all. Opinions are stupid. You know, everybody has an opinion. There are no opinions in this kind of things. There are analysis. Right. And it's all about probabilities. So we're going to be more going down or up, what are the probability of the market looks like. And all based on science and data. So there is no opinion here. A British huddle as opinion and most of his opinions are wrong, you know, because it's just a bunch of nonsense based on whatever happens in the market. Oh, if this happens when these are there, there is no logic behind that. Right. Because it doesn't follow that if you, you're not based your arguments on some level of data, it's, it's worthless. You know, it's entertaining and you can tell it with conviction and then it doesn't happen. You know, see all that think what people say about the strategic reserve, you know, it didn't happen. Like people describe it, it's game theory and everything. It is just opinions. These are better opinions. We are not dealing with opinions, we're dealing with data. So I love it and I think there is a lot of things to learn. I like that red building up because that red, it's meaningful. Right. And notice the price is about around that115.120. By the end of a, a year by bitcoin power law alone, we should be around something like 1:30, 125. So it's kind of in that region. So hopefully we break through that. Right. It doesn't mean that we stay there. If we break, look at that, we go to 130. Right. And so it's really cool and interesting.
Let me give you a, let me give everyone a clue. Right?
Yeah.
You're a physicist. So can you go at least in this realm that we're using now? It's tough to go in two directions at the same time. Right. That's pretty tough to do, right?
Yes.
So we just break it down in simple terms. The market is showing you that it is taking this side and it's obviously not affecting this side. Correct. We can all see that. Right. So we have all the clues that we need. What is it doing? It, it got very close to some very new liquidity. This pool is extremely new. It's not very long. It's only a week or two old. And they got close and they absolutely. It just did not touch it at all. Got super close. Could have easily taken that out, right? So it's telling you, it's showing you that it is not ready to go in this direction yet. It's still in this direction to neutral, right? Not necessarily going this direction either, but it's definitely not going up yet. It's kind of neutral right now. It's telling you that. And what is it really doing? What I have observed after looking at these things for countless hours, that the market is like electricity, right? There's a gap here and it needs to have a circuit. It has to have a way to get to this level. It needs to create a conduit, right? So if you think about it, what it's doing here, this is a conduit and it's building this up so it can have a bridge to get in to get to the higher prices. It won't do it when there's not enough liquidity to take it there. So just, just simple observations. And one last thing. We can kind of see what it did last time, right? When it made up its mind after taking the other side. Once it finished here, it turned and it finally. Right here, it didn't address it there, it didn't address it here. It finally started addressing it the other side and that started the path. So it's going to give you all the clues you need if you observe it.
Yeah, makes sense.
And what's interesting is that how violent it is when you get to those red pools, right? Is that once it hits those red pools, it's just gonna fly. Because it's a cascading liquidations, effectively. It's forced buyers for sellers. And that's what's building up there as we can see in that 115.
And if you notice, and if you notice, the market is extremely consistent, right? It did not harvest until the harvest was fat. The harvest was good and ripe right there. And that's when they made their move. Made its move. It did not touch it when it was thinner and just let it keep building up. That's why it ranges. It ranges trade liquidity on both sides and.
And apoll apologies for people are placing.
That'S long and short apology for the.
People that understand this thing. So maybe, you know, some of the people were still trying to understand by the time we arrive here what happens. What these red curves means, right? Red dots means. It means there is a lot of people who want to sell. They think the price is not going higher than that is going there and is going to stop. Right. And then they can make money by the price correcting down. They are taking a big huge bet, right. Some of these, by the way, A lot of these are also some of institutions that are creating almost like traps, right. They are giving you this illusion that there is this barrier. Then at the last moment they pull the orders out. Etc. But are a lot of people betting on this when the price arise there now more and more people join a lot of inexperienced players that think oh wow, that is a move to do. You know, I want to sell because the price is going to correct. And they use crazy leverages like 100 and things like that 50. And when the price actually doesn't stop because it has a. A very strong momentum up they their position get liquidated. So they are forced instead of selling to buy because of these how they, you know, if a price goes too high, we need to buy, they are forced to buy. And now all of a sudden that gives even more fuel to the move up. And this is how the marketplace, right. This is exactly what happens. It is why a bunch of cells can actually create more buying by being liquidated. So if you understand these mechanics then you understand how the market will works. It's a very important thing.
And another thing to add is that these bubbles are also formed. You know, this is a highly leveraged market. Without leverage this wouldn't be happening in the way it's happening. So another reason why these bubbles occur is because of the over leverage in these markets. This is how it all works, right. If this was just. If bitcoin was just spot and that was it, we wouldn't probably wouldn't have these cycles, you wouldn't have these bubbles. It's the leverage that's in the system that allows for these things to happen. Because as price goes up, more leverage is added and increases overall the bubble sizes.
That's it. So I'm going to turn over to you now.
Thank you Marcus. Now Costa, we are coming close to the end that you want to.
Yeah, we'll quickly look at some positions. Yeah, it's interesting just to see from where we were last week because I know we. We're in two positions. So this is the.
So what Just give me an. Let me give a small introduction with Costa is to going showing us is our trading system and I know there are a couple of questions but we are going to take this question at the end and the system uses the power loss Support is one of the things that you uses as its reference. And we will explain how. But we are seeing how the mark, the trading system took advantage of a recent movement in price. But please go ahead, Costa Rica.
Yeah, so we can dive in here. I think last week we were ranging somewhere here. I'm not sure if we'd made the second order yet, but as you can see, when the price dropped down to 80, we'd made our second safety order. And then you can really see it in action here. So there was a slight rally market. Well, not slight rally. We moved from around 5.9% and that's where we ended up taking profit. But let's zoom in right here. We can see exactly where it took. So this is a trailing exit on that one. When we have larger moves, we use a trailing take profit. You see it didn't catch the top, dropped down a little bit, but it closed out there. And then the market dumped on the news of the tariff and we re entered the position and then opened another safety order. So as you can see there, you know, we closed the deal really nicely and then we've created a new deal like that. So like a lot of people sitting there, nothing's really happening at the moment. A trading system like this does allow you to take adv advantage of all these little movements. We can have a look at the more high frequency version. This one has a fixed AP because it's running a little bit of small coverage. So we can see this ends at actually three positions. We can see these beautiful entries that we're making. That's part of the confluence of our trading signals. We're using mathematical base, but then our technicals are far superior to any kind of fixed mechanical strategy. As you can see the entries there. But yet, just here on the rally, just before the market went down, you see, we took profit there beautifully. And then we've got this big crash down there with the tariffs and we've made another two entries. So we're making money. Basically. That's how it works. Obviously, trading Bitcoin is so much better than trading anything else. We don't really touch altcoins for reasons. Too much volatility, unpredictable bottoms. And if you, if you're smart and you have a solid system, Bitcoin can deliver amazing results. As you can see here, there's enough volatility even in these tight ranges for us to do extremely well. You're on mute. J.
I forget. So again, please, if you're interested in the meeting, we are going to have a las Vegas, Just the last day of a conference of Bitcoin. Yeah, 5 DM, me or Costa and let us know if you want to join. It's mostly invitation only, but we still have some places for very motivated people. So DME and we will get to get you an invite. It will be great to meet all of you that are very strongly interested. Okay, let's take at least one question. I think it was a good question.
Yeah. And if anyone wants to jump on a free consultation call, please, DM G. Giovanni or myself. And we'll get you on a call with one of our specialists to go through the strategy, how it works and how you can set it up on, you know, whichever exchange that you're using.
Yeah. So looks like the stock market is going to crash. What do you think is the lowest. Well, it's crashing, right? I think. I don't know. You know, it's one of these things where R cell buy. The rumor sells the news. Right. The news are already there and the market is processing. I think it's like always is overreacting because yes, the tariffs are bad, but I'm not sure we are going to have all this impact eventually, you know, everybody will simply adjust to the new situation. But. And it's possible that, you know, something actually happens like Marcus say out of that where they decide to print even more money and that is going to be good for. For bitcoin. So I. I don't see it as this catastrophic event. It's mostly a local event. I could be wrong. Now remember, we have that solid support and that is our reference point, that solid support. Right. Now I can give you a number. I think it's in the 40s. I can, I can give you a more precise number. Yeah, close to the 40 000. So that is really, you know, it doesn't mean that it will never be violated. No, because in theory we don't even know if gravity is not violated.
Right.
We know, for example, we are still dealing with this issue of dark matter because when we try to see if gravity applies to stars that are going around the galaxy, it didn't work out. It didn't work out like with Newton theory, like it works with the solar system, it doesn't work with the stars and people are the two options. One was saying maybe gravity doesn't work like we know it works after a certain distance, or maybe there was some additional matter that we didn't account for. And the debate still continues. The community tends to say there is dark matter, but we don't Know, we are still debating on that. We are still trying to get more information. So even gravity is not certain like people think it is certain, right? Nothing is certain. Science, all what we can do is to use rationality, evidence and illuminate, right? We bring this light of knowledge further and farther away and we learn more. Right? This is all what we can do with anything. So for what concern finance? I never saw such strong point of reference like that power law in Bitcoin, the support line. So this is why having a trading system that is based on that, and maybe Costa very quickly can tell us, what do I mean when we say because somebody was asking some, the Zulu pilot was asking that question, how do we integrate this concept of a power law into to the trading system? Can you explain it in few minutes?
Yeah. So when you're using any kind of strategy, you need to basically, you know, you're dealing with an infinite price, right? If, if, if you just create a bot that trades well, how much coverage will you have in price? You obviously the price can drop 100% and it can go up an infinite amount. So if you have to factor all that in, the returns that you can generate, very, very small, if not impossible to be consequential because the range is too broad. By allowing to have the power law support gives us a roadmap. It gives us a framework to the algorithm. Everything that we do, all the settings that we have, we work against that. Everything above that line, the algorithm is going to be profitable no matter what happens. Now, obviously, when we're trading futures, we also have liquidation risks, right? So what we focus on is protecting the position by placing any kind of liquidation that we may have below that line. Now you can also set this up without any liquidation risk by simply adjusting position size. So it really is a trading system and a consulting that we offer to help people calibrate the the system that we use. So again, I've spoken this about a few times. We don't give people just a bot that's out of a box and they just plug it in and run it. We actually are able to work with you directly, one on one, to figure out exactly how you want to calibrate the system. And then we use things like the power or support to give us a more refined approach to how we're then going to calibrate the bot itself. The bot itself or the strategy itself is more like a Swiss army knife. It's about programming it to get you the returns that you want based on the advice that we're able to give and then things like the power law support give us a framework to be more specific, more scientific, more data driven and more accurate. And also to make sure that the returns that we're generating are the highest possible based on the volatility in Bitcoin. So again, it's like you've got this Swiss army knife and the power law gives us a framework to put around it, which. Which almost makes them the missing piece. That's why this collaboration is. Is so exciting to us.
Yeah. So in other words, you know, the idea is that you are range of possibility. Right. And you are trusting. It's not trusting is, you know, evident space that there is this very physical, very meaningful level where Bitcoin historical never went below that. And that gives you a frame because when you size up the different safety orders, you can, you have a point of reference, you calculate it. Now you can decide, okay, I want to be even safer than that. I want to be 20 below it, I want to be 30 below it, you know, but at least you work with something. And that is all what we can hope, right? With science. This is why, you know, I don't like prophecy, because at prophecy, I don't know where he took this prophecy. I don't know where he came from. I don't know if you're crazy, you know, at least you know our thinking, right? And then you can decide, well, I like that thinking. I don't like the thinking. I like that process. I think it gives me some. Something to work with. And you are an aware participant, right. You're not just simply trusting anybody. You are verifying yourself. Of course, you rely a little bit on our expertise in our, you know, experience. But it's a shared knowledge, you know, this is how it should work. Anything that has to do. That is the difference between people that tell you to trust, your people that tell you to learn, you know, and understand. We are actually in fact the Minotaur trading system. It's a. It's a relationship where it goes in both direction.
Right.
There is some kind of selection process there too. If you are not interested in learning and want to be an active participant, maybe this is something that is not.
For you, you know.
Anyway, I think this is, it was a good show. We cover a lot of things and we can close here and see each other next week. Thank you so much everybody. And thank you, Costa Marcus to for your very interesting analysis. Hi everybody.










