Bitcoin Live with the Power Law & Minotaur Team, #9, 5/15/2025
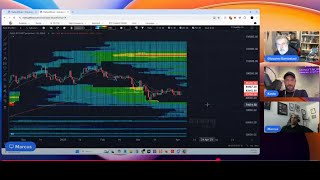
Giovanni presents a power-law price model with support levels and bubble channels. Marcus maps futures liquidity across leverages, targeting ~110k with a pool top near 140k. Sebastian and Kosta introduce Minotaur, a trading algorithm that dollar-costs into power-law bottoms with two preset modes.
Chapters
Hi everybody. This is our Thursday show. And the name of the show is called Bitcoin Live, also called the Marcus show, because everybody's asking for Marcus. Even last week when Marcus is coming to the show is this is sure too, you know, all the time. He's not a guest. This is our team.
All right, awesome.
So, and the goal is to discuss, you know, the latest things that are happening Bitcoin using the different power law indicators that I develop. You can see below where you can actually get the indicators. You can go to that web page if you're interested. That gives you also access to our Discord community. We have a about a thousand people there. We do analysis of the price, you know, different lectures, introduction lecture about the Pablo. So but let's jump in and let's go directly to the chart share screen. All right, so I'm going to share this particular chart. This is a one of a many ways. In fact, actually you're seeing here three different indicators superimposed on each other. You see the general power law I explained many times. Unfortunately, there is no a simple way of showing the log log graph. It's more natural for humans to see time linearly.
So.
You know, it's in a 7K chart. It's just that the straight line of a power law is not completely clear. It's straight here because if you look at the short time, it will still look like a straight line. But if you look at over long period of time, of course it's curved. Right. So if I zoom out, you can see that it starts to be curved. It's only a straight line. If I take also the log of time, all the calculations are based on the power loss. So the central line, to clarify is the, let's say kind of an average, right between the large deviation of the peaks and the support line that is indicated here by this black line. Now what is the blue curve? The darker, let's say, call it, let's call it purple line. The purple line is what I call the full model and I explain it several times what it's supposed to do, but I need to explain it a little bit better. And what, what that does. It's trying to, you know, having one single graph, all the different information that we discover about the public law, for example, the support line. So you see, it's not easy in one single equation because one of the things that needs to be explained that actually everything is an equation here. It's a, you know, it's not based on, you know, me trying to fit the Data as it comes. It's just one single equation that is calculated ahead. That is one of the things that distinguish it from what is called ta, where they, you know, try to feed the data manually many times.
This is all I need your mics out. Giovanni, my max mic sounds very distant. Your audio is not the best. Yeah.
What about now?
Ah, fantastic.
Okay. Not better. So, yes. And so the full model tries to include the oscillations, right? We see these bubbles and we are oscillation because we're really very, at least up until now, we have been very consistent in time basically every four years. So this is what we are trying to reproduce with these bubbles. Every four years there are these oscillations. And so we kind of almost bookmark them, right. So we are not trying to get the that time, but kind of a region where the bubble seems to happen, right. Part of this is this interpretation that, for example, this bubble here was double the other two peaks and the real bubble up in here and not here. This was kind of almost like, you know, it happened, it happened before time. It was a false alarm, you know, it was, you know, it went pretty high. But the second bubble is what really seemed more in line with everything else. Now this bottom part of the graph, it tries, not perfectly, but it tries to also include the bottom, right? It should be as close as possible to the bottom. Like I say, it's difficult to keep in one single model all these components. It doesn't do a perfect job. The real bottom is really the black line, but it contain, supposed to contain this oscillatory movement where we go above a blue line, this, this light blue line, and then we go below the blue line. So basically there are two regions, right? This is what is indicated in red here. There are this region, we call it the turbulent flow. And then there is the core power law region. It is when we are below the blue line and we usually stay there pretty consistently. There have been few violations like here and here, but usually, you know, we cross it or we touch the blue line, then there is a strong correction. Now I think one of interpretation of a top in these cycles, we have mentioned this before, is that the ETF push the price too fast, too quickly, you know, up, and we arrive above a power low. Then we had a correction to bring it, bring us down like it happened here, because it doesn't want to be there. He wants to stay. Since the bitcoin was to stay close to the core power law during these two years. It's actually very interesting because these Last two years. And then when we are above the power law is also two year period. But you know, the correction differently from what happened with the. The last cycle. We had a basically a reset. This, this event here is Covid. You see how strong of a correction it was almost vertical. And then bitcoin recovered very quickly, more quickly than stocks and gold. But notice what happened. We reach there, we kind of weaked down. You know, like basically this was kind of a wall, right? Very powerful support line even here. This thing in the past, the super line was barely violated ever. And then we bounced back and. And we had a very strong bull market this time. We had within average that we had a little bit of a correction. And then you know, we went up, we arrived to the time when we are supposed to leave a power law and we stay there and then we add another correction maybe because all the momentum, all the compression, you know, that we needed are resetting. It didn't happen. So that is a possible interpretation. What is interesting though is that if you look at trying to magnify these, if you look at since basically when this happened. So if I start from here, since kind of the beginning of April, we follow again this part of it I indicated here. That is the full model, right? How we're supposed to go higher and higher and reach the peak. The peak is supposed to happen at the end of it here. If we follow previous patterns, it should be at around 200k. We did it many different ways with Steven. He did it, did this calculation at least three different ways. And we always converge to these numbers, these under the assumption that the patents that we have seen before in the cycles continue. So there are many people that are claiming oh, we don't have a cycle anymore. They are trying to dismiss it. And I will say it's too early to say that. I actually we seem to. We are on a path that is consistent with my full model. And so we are thinking that. And this has not broken and you know, has been consistent at least since April. And we are continuing to move in that direction. So we, we will see if these continues to apply. I made some projections, you know, for the next three months, six months, it depends where we are right now. We are close to this 70% quantile in this model that divides all the different deviations in quantize. And so if we go three months from now, we are supposed to be around 115, six months. So this one will be close, you know, to the time we are expecting a peak anything between six and nine months. From now. But usually when we have like you can see the peaks are not 0.7%, you know, 0.7 quantile or 70% quantile. They are more close to the 90 quantile. I, I don't, I think because of the diminishing returns, we are not going all the way to 95 quantile. These, in addition to the quantile, I'm also showing this decay channel that shows the exponential decay of the peaks. And you can see at most we are close, you know, to, in this range, anything between 200 to maybe 220 max. It will be very unlikely to, to see these 95 quantiles, you know, like above, let's say 230 or even 250. So this is a, you know, the weather report so far. Using the power log, we can see other indicators, but I think these are, gives us enough information. Okay, so this is my component of a analysis. I leave a ground to Marcus that will talk about liquidity.
Okay.
Yeah, the conversation with Stephen yesterday was great. Gio talking about the, the quantiles and the standard deviations that we can reach and where it probably won't go. I think it's very helpful for people that are looking to make decisions at the top of the cycle. Definitely a lot of this work is, is going to be very valuable for people at that moment. And I think they probably should start thinking about, you know, decisions to be made then.
Yes. Okay, can there. What we're looking at right now is a Bitcoin daily chart and we are looking at the Bybit perpetual futures. We always like to start with futures because they are a price discovery engine. The price is discovered there. I hear Giovanni, somebody's getting some feedback there on some typing or something. All right, so we use the Bitcoin futures as a discovery price discovery engine. So right here, what's very interesting from the last week, we've been building on this correlation between Bitcoin's price. It was a little bit delayed from the power law. And Giovanni was just stating that around April 1st or 1st of April was right here when Bitcoin determined that it was late for the party and it decided to get on track in a hurry. So right here it made a very strong move to, to catch up to the power law. So right now with this move that we've had for the last 37 days, been almost straight up and it's gotten right back on track with the power law. So let's add in the liquidity and see what is causing this move here. There's Liquidity here. There's liquidity built into these zones. Let's take a look. And there it is. The engine behind the engine. Yeah, right here. So we'll back out some of the light stuff and we can just look at the concentrated composite liquidity. So as we can see, we've been building up a tremendous amount of liquidity. When we broke out of the previous zone in November and we got in this range, we started a brand new liquidity event, we began to build up liquidity. And liquidity is used synonymously with open, open interest. For you purists out there, liquidity is actually the event where it is liquidated and the ease of price movement. But it's actually specifically open interest. But we'll use the word liquidity sounds better. So here on this side, this is the short side liquidity and this is the long side liquidity. And what happens is in the market is fractal. It works at all different time frames. So when we enter into a new zone, the market will consolidate all the algorithms, thousands and thousands of algorithms working simultaneously creates this phenomenon. And then the liquidity will start to build. So price moves off liquidity and liquidity attracts price. So they're one in the same. And over time, as this cycle continues, the liquidity gets bigger and bigger, bigger on each side until it's ready to be harvested. So we started the downtrend that was in actually right around mid February. We made a big liquidity liquidation event there, middle of February. And then we completed. We kind of bottomed out around the point where we needed to get back on track with the power law 1st of April, and we stopped liquidating the short side and we have reversed course and we're beginning to liquidate the long side, as you can see here, these impulses and we're liquidating the longs and we have currently. Everybody wants to know, okay, where is it going to go next? Well, your eyes should be drawn to this extremely large amount of composite liquidity here. This is a combination of 25x10x5x and there's actually 3x in here. I'll go ahead and highlight that. So there's a ton, a ton of liquidity up here. And the price is drawn to liquidity like a magnet. So at some point we're going to liquidate this, but in the near term, let's take a look at. I'm going to back out to the 25x. The highest liquidity is what's taken first. So 25x is going to be liquidated before 10 and 10 and before 5, and 5 before 3. So the market likes to go in phases. So as you can see, there was a level of 25x here, a level here, and a level here. And then simultaneously as it liquidates these levels, it builds levels to come back. So right now we've already terminated the first level, 25x. And the second, there is one remaining 25x left. And it looks like, in my opinion, it'd be a high probability that we take this next level at 25x and that takes us to 110. And maybe at this point we might expect some type of small correction here because we haven't had anything. You can probably notice the market has gone straight up without any reversals or pullbacks or retracements, nothing significant. So at some point we're going to do that. And the most probable place to do that is after we take out this last level of 25x. And then we should be looking for a pullback before we continue on. Because what typically will not happen is you cannot reasonably expect to. To liquidate this entire area here, this entire liquidation, this tire liquidity pool in one impulse. The market doesn't take it at once. So we'll come up here, take out the 25x re position and then slowly work our way up. So to keep it kind of short, that's kind of the high level. I can get into more specifics, but that's how it's looking right now. Probably coming to this area here and then terminating. When we're talking about the entire pool, we're looking at about 140k. And then just to get an idea of how far it can go past the pool, when we liquidated the last event in 2024 of November, we went up an additional. We went up an additional 20%. So when we liquidate this pool, that get us to.
That gets to right.
20 plus 10, another 30, fuel 40, 50, 60, maybe potentially 170, 180.
Exactly. So let me draw it in, let me. We gotta, we gotta keep up with Giovanni's power law here. So when the market terminates this area here, then we go 20%. So here's the top of the liquidity. This is what's here, this is what's in the market. So we can calculate that and then we'll go up an additional 20%. So we're already here, that's at 1, 163. So we'll draw that line in here, 163. So that might be our new top. So we'll come Here. And here's what gets interesting. Once we come up here, will have to form new liquidity pools. Right. So there'll be a new pool starting to grow up here and the process starts all over again. So that secondary, that next pool can take us to 180, 190, 200. That's how we get there. As the market consolidates, it grows the pools bigger. So we'll be billing his long pool. So that's how we get there. And that is just from my Etch A Sketch here we're looking at. Yeah, that's on schedule. That's around what the power loss stands in. November, December, October.
And then what happens at the top of the cycle? Does that mean that the market just pulls back, reverses before there's time to build up any kind of significant liquidity?
Well, here's what's interesting. At some point it won't just keep continuing to leg up. You're going to, you're going to wick in here and then we might just start coming down.
Yeah.
For a while. Yeah. It's not, we're not just going to keep making new levels and taking them. At some point it will exhaust.
Yeah, yeah. Interesting that this is lining up with the projections and your indicators as well, Geo, isn't it?
Especially right here. This is amazing right here, this part here. I mean everybody was. Yeah, that's crazy because.
Is there a way of. Can you, you have the indicators, right?
Can you.
Maybe next time, I don't know if we are prepared, we should maybe test it to project the. Indicate the, you know, to show also the power law indicators on top of this chart.
Right.
This is a, it's a trading view chart.
Right?
Yeah, we could probably look at doing that. Yeah. Yeah. But.
But it is interesting. Next time. Yeah.
It is amazing how violently it went up to get back on track with the time. This is just, this is no pullback. This is just basically straight up.
Yep.
That's crazy. Yep.
And, and we mentioned. Right. I say that since April, the power laws price started to follow the full model. This when they say, oh, it's full the beginning of April, I didn't see your chart. And you say, well, that is exactly when it happened. You know, when this new movement happened. And that also converges with the global liquidity. Because if we look at the global liquidity, we see an increase in global liquidity. And you know, this entire, the average, the shift of 85 days between global liquidity and the price. So everything seems to converge. You know, it is really nice.
Yep. All right, I'll let. I'll turn it over to the next.
Yeah, in fact, I. Maybe I can show for a second global liquidity chart and then I can. So this is the chart. Yeah, so this is a chart I was mentioning. So this is a model. It's also another of our indicators where you see the purple line. The purple line. Many people show the M2 directly. And so, you know, I was now the first person to see this shift. I didn't see it. When, when I am first on, on something, I mention it, and when I'm not, I also mention it. I, I don't know who was it maybe Raul Paul that was insisting on this? And what I did, I went back and I tried to use all kind of statistical tools to verify if what he was describing from a qualitative point of view, because I never saw him do any real calculation was actually based on real math, you know, because people tend to see patterns right where patterns are now there. And you know, basically it's like seeing Jesus on a tortilla, you know, is this real? It's not real.
So.
And it turns out it is. In fact, it turns out 70% of the time that M2 goes up, the price also goes up 70% of the time. And these are, you know, for daily moves. Now it's more consistent when you look long period of times and less when we go down about something like 56 of the time, 60% of the time. So there is a strong correlation between the two. It's a question of, you know, how closely every little twist and turn corresponds between the two that it would be ridiculous to claim that they really do. And, and there are some analysts that they go to that level, you know, saying, oh, look, you know, it's going down, so I'm gonna. No, I, you know, you have to take it as a general trend. But you know, here you see that we are following this liquidity run up, you know, of the. It's kind of liquidity is kind of start to flatten out a little bit, right? This is the purple line. And the purple line, just to explain is no liquidity per se. It's a model of a price based on liquidity. So it's slightly different from what everybody else show. And this relationship is a power law. So if you look at the last 10 years of data, it looks like there is a power law between. It's a weak power law because that doesn't extend over entire history of Bitcoin. One should take it, you know, with a grain of Salt. But it gives us the opportunity to make a model, you know, to predict a matcha. We are going up. And again, if you look at the standard, let's say we, we go all the way to the end of this run up, where it seems like liquidity starts to kind of flatten a little bit. We get as close to 130. And what do you. What were you getting before, Marcus, when you were talking about the next level?
Exactly.
About 130. 140. Yeah.
So again, you know, it seems, it's nice to see convergence of different indicators saying basically the same thing. So it's interesting. Yeah. This is another view. The. The picture below shows, you know, the winning rate. The yellow is the M2 model, the blue is the price. And you can see, you know, whenever you see a rundown of a M2, the price follows and same thing. Remember, the orange is kind of a leading indicator because it's 85 days ahead of time. So it's another tool to look at, you know, to tell us where we are going. So we still have, you know, several weeks, if not months of upward movement, you know, very big corrections, but we are supposed to go up most of the time. Okay, Costa, do you want to talk about our bot and maybe give a little introduction for the people that maybe add a news to a show?
Yeah, let me bring up. Yeah. So, you know, our trading system basically is actually. Sebastian, you can give it a bit of an intro. You haven't been here last one. Do you want to give a bit of an intro today?
Yeah, sure. So for anyone new listening in on the show, welcome. And yeah, we're going to just do a quick little demonstration of the algorithm here and what it's designed to do. Now, inherently, of course, when we tune our algorithms, it's always with the power law in mind. So the hard bottom that Giovanni was showing at the start of the show really ties the whole system together. And when I say tie it together, I talk intrinsically about understanding risk management and where your levels need to be within your trading. So our algorithm does have this hardwired into it based on the risk management that we take and how it's going to trade. Now, obviously, as you can see here, we've got an upwards trending market. Now, to be clear, the algorithm is actually really designed for downward structure and bear markets. But clearly, as you can see on the screen, it trades upwards price action very, very well also. Now, the reason we put the focus on downside trading is that of course, usually when price is trending up this is the price action that a lot of people can have success in. But of course it's when the market dips is when everyone gets eaten alive. But just from a high level over what the algorithm is actually doing. If you can see the screen, what you're noticing is entries and hard exits. Now the algorithm has been built on a multitude of different technical indicators and also maths to give us a really strong entry. And as you can see on the chart, you know, the algorithm is not perfect, but what we've designed is something that has very, very powerful entries and also a very, very powerful understanding of where to get out of the market, which I would argue is probably the single handed, most important thing, right? And Giovanni's mentioned this previously on other shows we've, he's run a lot of algorithms and there's a lot of algorithms in the market. But the key really above everything else is the risk management, but also the execution. It's very, very important. So just seeing here what the algorithm is doing, we're never layering a lot of our money into the market at once, right? We're simply using small amounts of the capital to slowly dollar cost average in over time and pick up these local bottoms. And this is really, really important. Now another thing Costa's showing you here in terms of a feature, as you can see, we did pick up the local BO for an entry, but since in this example we're using a trailing take profit, you can also have a look at how we're able to capture upside in upwards movements as well. Because this is very important. And as you can see that whole leg up there, if you take a look at where we entered to versus where we exited, you can see a clear pattern with picking up the local bottom, right, right there, entering our positions, trading all the way back up to the local top, closing profit, right? So as you can see there, that's a 10 capture right from bottom to top. So the algorithm didn't only pick up the local bottoms, it had the ability to sell. And then as we can see, we've entered another new position. Now if you look at that entry, I mean, very powerful stuff, the market's trending back up now and if we go back up to the top there quickly, Costa, we can see a similar pattern, right? Closing, local top, entering, exiting. So as you can see, the execution engine behind what we've developed, it's very, very powerful and it gives you ability to capture the right kind of entries. You need to, especially in markets such as Bitcoin, which have Volatility behind it. So that's an overview of a high level, of what the algorithm's actually doing. Did you want to add anything to that, Costa?
Yeah, I wanted to add, just to sort of tie it in with what Marcus is saying. And the market has to go down in order to go up. And this is why the strategy and the system that we build really is a perfect way to capture that, that, you know, those ideas is that if, if you have an algorithm set up and it's automated, it needs to be able to capture downside and then be able to maximize the profits when it goes up. And you can see when the market's trending upwards, it's very easy to make money. You know, you make a couple of orders, you take profit. The difficulty is, is when the market does the opposite of what you expect. And our system has been developed very, very smartly, that it really is. It doesn't really matter which direction the trend is going, but we're going to be able to capture the volatility and profit from it no matter what. And what else is unique is that we're not actually flipping between a long and a short position, that the strategy is long only, which does remove a lot of, well, the short risk when you're trying to cover the, the power, the full power law band of the price action, which is what we do on these main two setups. So another thing I wanted to bring up is when we on board of a lot of our clients, because I do know a lot of potential clients watch these lives, we have two setups and maybe Sebastian can dive into that. And then I did mention shorting, but I also want Marcus to discuss what he does in the trading desk, which does take this to another, other level because we get a lot of people set up on the two settings that we have. We've got more of a high frequency one. This is our standard one. This is a more high frequency setting. And then also some of the, let's call it, research that Marcus is doing in the training desk. So our algorithm, Sebastian, you can just mention how it's kind of like.
Right, yeah, well, that's right. So I'll touch a little bit on the two out of the box settings that we've developed through our own backtesting environment and live forward testing. And then I'll let Marcus take over and discuss a little bit about how he uses the algorithm to do a lot of different operations at a high level. So, you know, for anyone that's watching this video we're offering out of the box settings where you can plug and play. Now, I'm not saying the setup is as simple as a few clicks of the button, but once you get our settings going, we'll put you in a position where, for the most part, you do not need to be in front of your computer to have the algorithm executing for you. It's going to do it 247 and it's going to be focused on risk management. Right. And this is really, really important. So the key about the two settings that we set up is that of course, the power law bottom is always respected and in mind. Now, what does this mean? Well, for the primary setup that we use, it means we can cover huge gaps in Bitcoin's price and also be able to protect the capital that's in the account all the way down to the power law bottom. So, as we know, even though Bitcoin's volatility is actually dwindling over time, it's slowly getting less and less. This doesn't mean it doesn't have the ability to have 30 to 50% corrections. Right. Which it does. As we saw recently, we're in a bull run. It had a big. First of all, having enough coverage on Bitcoin's price is very, very important. Making sure the algorithms can handle huge selling pressure. But we take it a step further than that. We don't just cover and anticipate for the worst case scenario, we anticipate for catastrophe. But the beautiful thing about this is our algorithm will actually dollar cost average straight into the power law bottom, which is typically, as you just saw on Giovanni's chart at the start of the show, a level where you want to be buying Bitcoin. Right. That's the most incredible buying opportunity that's probably out there is when we get to these levels. So it's about risk management and coverage, but also more than anything else, having something that's going to accrue at the power law levels, which is going to put you in a position where you can get significant growth. The other setting, just quickly out of the box, is something that also respects the power law bottom, but also does have a little bit of a smaller coverage so that it can trade more frequently in and out. Right? So we use these in tandem with each other. Now, why do we do this? Well, as Marcus has said many times, the market is fractal. Right? And the market moves in segments. So the beautiful thing about this is we run one algorithm that essentially trades to capture large moves in Bitcoin's price action. And Then we run another algorithm that basically captures the smaller day to day movements. And when you put these in tandem with each other, all of a sudden you've got a system that has the ability to trade all the price action that's in front of you, which is a very, very powerful thing and respecting the power of the bottom. Right. So this is really where it all comes together and we get an efficient system that can handle the vast majority of price action on Bitcoin. Now, what Marcus is doing in the trading desk, I'll let him take over now and explain that. But you know, for anyone that wants to know more about these out of the box settings, I want to make it clear that this is what we recommend. But at the end of the day, this is a Swiss army knife. And when Marcus talks about what he does, you'll really see that you can do anything with our algorithm. Right. You really can. And Marcus, I'll let you take over.
Well said, Sebastian. Well said. You covered a lot of the internal mechanism aspects of the algorithm, but I want to highlight one topic and that's the future of where all of these, these marketplaces are going, especially crypto and the legacy market markets like equities and all that bonds. In the future there is, it's going to be almost impossible to do any type of manual trading. The 99% of all trading volume is computerized trading algorithms, smart bots, high frequency systems, and it is basically a warfare of thousands and tens of thousands of automated systems. And the only way you're going to be able to operate any type of investing or trading activities is you're going to need to have your own algorithms working for you. And that's the beauty of it. So what we built here with the Minotaur team, Sebastian Costa, myself, we built a world class professional grade algorithm that is the absolute leader in cryptocurrency trading, Bitcoin, especially for retail traders and small investors. So it is a, it is a professional grade 5 star algorithm that can do. Just as you were saying, Sebastian, anything that you can basically want to replicate it. What we do in a trading desk is we unlock, we unthrow the algorithm to unlock its full potential. The type of trading that we do is a more of an augmented trading system where you and the algorithm are in a partnership, a symbiosis, where the algorithm is the trader and you are the operator, you are the manager. So, and then if you understand that business relationship, who does what, it's very, very powerful. And you can scale it to the moon, where you could have a orchestra of algorithms, if you will. It's basically there's no limit to what you can do with them. And that's what we're doing in the trading desk. Very exciting and you're welcome to join us.
Okay. And we are going to have an event on that is associated with the conference in Las Vegas. In fact, this is going to be the last day of the conference and Costa can tell us about it.
Yeah, this is really exciting, this event. Obviously we're going to be flying there, we're going to have a stall. We're one of the exhibitors and sponsors of the BTC conference. We were in Nashville last year. Will be in Vegas looking like nearly 10 days or something like that, which is crazy. Yeah. So we'll be in the exhibitor section so you can come and visit us at the booth. And we are hosting our own private event with Giovanni because we want to give him the time and the platform to be able to share his ideas at the conference in a long form, lecture style setting. And we're also going to be so because of that, it's invitation only. But of course come see us at our stall and have a chat with us. And we're happy to to let you come along, especially if you've been watching the show. But we do have to just be wary of the numbers. That's why we're going to be giving out these passes like this. And it's going to be good. It's going to be a bit of a cocktail hour from 4 o'. Clock. We're going to have some drinks and some food and some niblies and then Giovanni and I will take the stage and Marcus and Sebastian will join us as well. We're going to put together a really cool presentation and have a conversation and a Q and A and of course be able to meet you all in person. I know Giovanni is excited to meet a lot of people from his Discord community, from the X community and also clients where we're very excited to meet clients and future clients as well. So yeah, we put together this event and we encourage everyone to reach out and they can DM Giovanni if they want to get added to the list as well.
Yeah, please DM me if you really want to come. We have a really kind of a full, you know, list about we can make space for a few more people. So if you're really motivated, DM me and come to see us at our booth at the conference. I will be with the Manotor people also at the booth. On a regular basis. I will have some power law charts if you want to discuss or ask questions. You know, because the conference actually, you know, to be honest, talking first they told me I was going to be in a panel and then for some reason they say we're not covering the power law. That I think it's mostly political because a lot of the people in the community in the, in that conference are formal based. And that is one of the things that, you know, I don't want to be polemical, but it's one of the things that distinguish us. In fact, I like about the Minotaur system that they are realistic. Right. We are focused on. We are not making crazy promises like, you know, we are going to 10 pair your wallet. You know, you're a, you're a stash in one year. You know, we are not making any crazy claim like that. It's all based on realistic understanding of bitcoin of a power law and using the volatility that is there, but with realistic goals. You know, ambitious but realistic. That is what is all about. So we are having our own event around the conference and I think I, I like this format better anyway because in a panel you get to talk for a couple of minutes. But here we will have more connections with the people that really are interested. But it's really an elite, right? Stephen says, my, my partner in the physics of bitcoin show, he says, oh, probably 1% of the people on Earth understand Bitcoin. 1% of that understandable power law and 1% we understand, you know, the bimodal nature of bitcoin, which we have this bubble and we have a core power law. So you guys are the elite of elite, you know, so, and, and I think actually the people that want to use some of these tools like you know, the Manotar systems is that is an elite of elite, really a restricted group of deserves, you know, whatever great things are going to happen when you focus on realistic objectives. You know, ambitious, but realistic objectives.
Yeah, I think to use a Marcus metaphor, we can say that Giovanni gives us a racetrack and we got, we can give you a racing car to put on it.
Definitely, definitely.
Okay. I'm looking at the questions. A few nice comments, but Dario is watching us. Dario is actually one of our, you know, members.
What's up?
Hi, Dario.
We're going to do a show with him actually next week. But anyway, I think the thing, the only question that seems interesting is this any reason why by bit versus the binance data, when, when you do your Liquidity.
That's a, that's a good question. You, we, we, we run our algorithms on Bybit. Binance is probably the highest volume exchange and then Bybit is probably going to be a close second. But what tends to happen is when you look at the leaders, then they're gonna all mirror the same data. It's very, very close. So if you just look at one of those two, you're going to have a good picture. It's one in the same. So. Yeah, good, good, good, good point to catch that. Yep.
Exchanges will follow suit markets. Right. From finance anyway. I mean, looking at, you know, they're very similar prices.
Yeah, very basic, very similar. And the reason we choose By Bit is just our preferred exchange that we use.
Yeah. What I like about Baby from, you know, user experience, I like how they handle, for example, margins. I think it's a better setup. I like the interface. There are many reasons to like Baby, but, you know, exchanges are exchanges so they should be very similar. The major ones.
We've actually met them in person in. We've met them in person as well. Some of the, the team we've actually met. Sebastian can talk. He's actually met with the developer of the Unified Trading account. We had lunch with them in Melbourne. So, you know, byit is willing to come and have lunch with us, which is fantastic. Maybe you can talk about that, Seb.
Yeah, well, there's a man named Danny Shan who actually develops all the algorithms for bybit. Now, I'm not just talking about algorithms for price systems, I'm talking about understanding algorithms for liquidity, how they do their calculations, everything. And, you know, we sat down with him for lunch and really picked his brain about everything, right. And he leads a gigantic team of developers. But, you know, in terms of exchanges that offer tools that can assist you with this style of trading, they're probably the leaders in the pack, to be honest with you guys. And some of the things that their developers are doing and that their creators of algorithms are doing, I mean, even for me, someone who's had a lot of experience with these things, some of the stuff was going over my head. So it is, it is very high level and, you know, it is one of the primary exchanges you want to be trading on. Costa can talk on this also, but if you want to do research around Unified Trading accounts and, you know, the tools that they offer, it's really incredible stuff. I mean, you know, it's amazing how far we have come from, you know, using a simplistic banking system to the kind of tools that, you know, Bybid and Binance offers us now. Right. It's really remarkable. And in a lot of ways, it's giving you tools that, you know, this is another advantage about being in the Bitcoin market is you have access to tools that most people don't even know exist. Right. And also tools that large banks and institutions have access to that they're using themselves. So, you know, the fact that a retail trader can come in and access these kind of tools is pretty remarkable.
Absolutely, absolutely.










