Bitcoin Live with the Power Law & Minotaur Team, #9, 5/15/2025
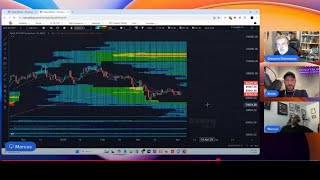
Bitcoin Live hosts analyze price action using a power-law macro model with an 85-day liquidity lag, projecting Bitcoin could reach 133k from liquidity alone or 200k when adding cycle deviation. The team explains how leverage layers and liquidations drive short-term moves and describes Minotaur trading algorithms designed to exploit these dynamics.
Chapters
Okay.
Hi everybody. Today is the 5:22. It's a very nice day. We had a nice action from bitcoin. We reach all time high in the last few days and we are here to see what is going on, you know, with the market. So yeah, I have, I am.
I.
Am here with Marcos and Costa from the Manotar system that are close collaborators. We develop bots that work with the power law principles. We are going to discuss these bots later at the end of the show. So let's, let's start and I will show you this two charts. The first one I want to show this chart that is. So this chart shows where we are with the price right here. And it compares it with global liquidity. So this is actually not global liquidity per se, is actually a model of global liquidity. So it takes global liquidity and if you look at the last 10 years, you can approximate the behavior with a power law. It's basically the bitcoin price equal global liquidity to 9.2. So a small change in global liquidity because of this big, huge power gives you big change in price. You have to include a delay because supposedly there is a delay. So we don't know why there is this delay. There are many interpretation. One possible interpretation is that, you know, you got all this money flooding the market and it takes some time to reach Bitcoin because it's considered, still now is considered a relatively risky asset. I don't know why they consider it in that way. I think it's a safe asset that is. But you know, most of the market is still thinking that. So it takes time for the money to reach Bitcoin. Maybe it's not something written in stone. It's possible this delay in time became smaller or something to monitor. But right now 85 days works fine. And you see two curves here. One is green. That is a kind of a smoother version of a model. And then the purple line. The purple line is basically using the power law that we observe between the price and global liquidity. So instead of plotting global liquidity directly, I make a prediction based on global liquidity above a price and then convert it into a price, Bitcoin price, basically. And so remember, it's about 85 days or 90 days delay. So it gives us kind of a preview. I will not take it kind of one to one. It's possible that, you know, we don't follow every twist and turns of this curve, but the general direction tell us where we are going. So there is a lot of Liquidity, we need that liquidity. For months I complained, you know, when we were here we didn't have enough liquidity. Now we have it and bitcoin price is responding to that. You know, we are going that direction. If we take at face value this prediction in the next three months, we are going all the way to about 133,000. And this graph below shows the winning rate of both bitcoin that is blue here. And you can see this is ahead of time because again you can use these. It's pretty amazing if this holds true in general because it gives us kind of a three months preview of where we are going again. You know, don't take it like if it was written in stone. It's more like an indication than a one to one thing. But I calculated usually when global liquidity goes up 70% of the time, the price of the coin follows. It's a little bit less when we have a corrections close to 60%. But you know, it's a pretty good indicator. The other indicator I want to show you is this one.
That is.
A cycle comparison. So let me explain this a little bit more complicated. Let's see if I can explain you this one in a couple of minutes. What I'm doing here, I'm using the power law. The white line is the central power law. The reference point, this one at the bottom is a support. The pink is what I call the full model. So the full model tries to combine both the general direction of a power law but also the cyclic nature of the cycles. Right. These periodicity of the cycles. The idea is that I'm using this terminology of the time. Nine is when the bull run starts. Twelve is the top of the cycle, three is the bottom. And so right now this is where we are basically this is a new cycle starting. You know, this is the equivalent of 9, time 9 in the clock. 12 will be the next top. It is here I, I use the end of the year as a point of reference. So the top could be any, anything within a couple of months. Usually it happens before the end of the year. So it could be a couple of months before the end of the year. Anything between let's say October to December. The projection is 200000 at his base on previous behavior. Basically on the decay of the top you can extrapolate it. And we had very large deviation in the past up to you know, 10 times like in the first cycles. The next deviation is more like 80%. So the, the power law itself, if you extrapolate at the end of the year it's going to be 130. If you add to that 80%, we get to 200. And here is what the other cycles look like in the past. So every time you go down by one, right? So this yellow curve, it's exactly. Basically is. So instead of some people superimpose them. This is another way of showing them because this shows the correct price of that particular time. So basically it's almost like you're going back in time by four years and then eight years. And you can see what exactly happened during these times in the previous cycles. And the previous cycle we added this strange behavior where basically see here it's kind of like it repeats itself, right? So you can see also what happened here, right? This guy is. This guy. We add a double top, right? But bitcoin still at the top where it was supposed to be here. I still decided that, look, you know, I have a, an early top, but I'm going to have a real top at where every other top happens. So it is basically quarter four of this year where we have a bull run. And, and so it looks like this, like now because, you know, at this time of the, of a cycle, last time already reach of a first stop, we had a strong correction and then we go back and have a top. So we are kind of more similar or maybe a mixture of this side this cycle and this cycle. The recycle eight years ago was almost like a textbook example of this very organized behavior. The price follow the power law bottom, you know, the support for quite a bit of time. Basically two years is how it goes, right? It goes one year up, one year down to your power law. It's overall still a power law because notice what happened when we go up, it gets canceled by when we go down. So the other result is the power law. This is why we have a power law as the main pattern because the bubble kind of cancel. But here we have two years straight along with power law. We didn't do this. We did it initially. Then we deviated because of a. I think the reason was the ETFs. There was a lot of cash injection, FOMO, the price was pushed up ratio power law didn't like it correction, but we didn't reach the support, right? So we still got a bull behavior. When November came, that is, you know, I draw a year by beginning of the bull, but really usually it's like a month before, like November and I announce it, I say, oh, you know, prepare for the bull. And we actually had the bull Then because of lack of liquidity tariffs etc, we got a very strong correction and notice what happened. We are back there. We are back to this purple, these are pink line, but it's supposed to be the full model. So it's almost like all these didn't matter. It's almost like if we follow the bottom and then we continue go up, we are there after all this, now we are back. So all the people that claim that the cycles were dead and you know, it's over, we don't have cycles anymore. Well, we're following this. So we are perfectly on the path of repeating what we had before. You know, maybe we continue to follow this line, we reach 200k and then the next question, the next big deal will be do we see a correction?
Right?
And we will see. We will see. I think these cycles don't have the strength and the value, predictive value of a power law. There is kind of a hierarchy. Today I was discussing these and they say if a power law is 10, you know, the cycle predictability maybe is close to 5. You know, it doesn't have the same predictive power. But so far it seems that even this periodic nature of the cycle is kept in is still valid. You know, it was premature to the, to dismiss it. We are going to see if it continues right, if we really reach a top here and then if we have a strong correction. Some people are already saying oh, we are not going to see a strong correction, blah blah, blah. And you know, I don't care about words, I care about what the data say when the data, when we arrive here and the data tell us we don't have a cycle anymore, we will, you know, we're taking consideration that right now I take seriously Bitcoin past behavior and that will mean we will have a correction. If we have a correction then we go all the way to 75 after one year. But you know, let's take one thing at a time. Let's see if we can go first. 200k. All right, so this is kind of my analysis for, for what concern the power law. And we'll switch to Marcus.
Okay, let me load. All right, let's see what the liquidity has to say, the local liquidity. Okay, really quick. What we're looking at here is a trading view, typical price action chart on the daily time frame. We're looking at the Bybit Futures Exchange. This is a leverage exchange. We like to look at derivatives because leverage is where price discovery typically happens first and the spot markets follow the leveraged markets. It makes sense because that's where the high concentrations of borrowed money is at. It's going to be speculation and all that happens here first. So we use bybit. All the exchanges are very similar. They're not very far apart because the arbitrage activity will keep them in parity. Okay, so this is your typical trading chart. As you can see, we have been going pretty parabolic here. And this line is this, this trend line is on the power law. It's just amazing how when we deviated away from the power law we got back quickly and we're running right on the bottom, bottom of that power law schedule. So that's pretty interesting how that occurred. Alright, so what we're looking at here on the daily is this, this new action here. So let's just see, let's start layering into liquidity really quick. For those that have are new, there's two things. Chicken egg, liquidity and price action. Price action generates liquidity, liquidity attracts price. So they are one in the same. Without price action you can't generate liquidity. And without liquidity you can't have price action. So all of these big moves are the result of some liquidity being liquidated. So now we'll add in the liquidity, start layering it in. I'd like to start off with the 25x today because, because it gives us a very interesting comparison. It gives very uniform levels. These are 25x leverage positions that are already locked into the market by that. They've already, they're either in drawdown or they're in positive P Ls. So they're not going anywhere. And if you notice we had levels from where this started. We had three levels of 25x and they've been liquidated. Each level has been liquidated. Last week we only made it. We were here in this area here and we were trying to determine where we're going to come down or we're going to correct or continue up. Well the probabilities say that the liquidity was going to be taken. So that's the last of the 25x at the top of the. This is the all time highs up here. So we took that level and now where do we go now? And we're still maintaining this trend line. Right? We're still on that trend line. So now let's add in the 10x leverage. So when we add in the 10x leverage we'll get a little bit more composition, a little bit broader picture here. And then I'm going to layer in the 5. This is the 5x leverage. People that have 5 times. And then last we'll add in the 3 to get the full picture. 3x is almost like spot. It's only 3 times and you can get a big good picture that we're still hanging in. We got some new additions to leverage here, and we're coming in at that 140 level. Typically, what can be expected is we had a nice amount of what I call what's called internal liquidity right here. The. These are shorts up here and these are longs down here. So this internal liquidity was formed when we had to move down, and all of these positions came into play on that move down. And now that's the first to be taken out on the reverse. So we've taken out all of the internal, and we're sitting right here. And this is what we call level. This is level liquidity because it's on a key level and it hasn't been tapped right, hasn't been liquidated. So we're right at that key level. Typically we take out internal liquidity, like here, take out internal liquidity, then you reverse. But in this case, what may be changing that is we have a tremendous amount of liquidity that's just built up right here above price. And liquidity acts like a magnet for price. So let me zoom in a little bit. So it looks like the Price is going to terminate this liquidity here before we correct. That's what the probability is looking like now, and that that pool is sitting at about 115, 17K. So we met more upside to go in the near term because it looks like the price is going right for that. And that's determined by thousands of algorithms all simultaneously running. That's what creates all of this price action. The algorithms are working in, not on the not. They're not. They're not in the same company or they're not manipulating it together, but they do it collectively. They all run in similar programs. They all have similar objectives. It's kind of like an ecosystem. If this was the ocean, you have different types of sharks, different species, but they typically do the same things. They may do it a little bit differently. So all of these algorithms are pushing this price in this type of format here. And this type of price action generates the liquidity. So if you don't have this choppy action like this, then you don't have the liquidity built up and that's required. And just to give you a little bit of background here, when price does two things, so we'll just go back to the 20, 20 fours. It builds up liquidity above and below. These are the longs, these are the shorts. It builds up that liquidity and then that's when it breaks out, when it harvests or liquidates that liquidity, when it takes it back. And that's what creates the big moves. So we had a big move when we liquidated on tremendous amount of liquidity in 2024, around the end of 2024. And that put us in this new range that we've been in for about five months now. And what happens is when it gets into a new, that's what price discovery is all about. When it gets into a new range like here, it starts off with no liquidity. That's why the price stops. There's nothing here. It stops and it consolidates again. And as you can see, once it starts that consolidating action, then we get new liquidity starts to build up. Oh, right here, like this starts to build up. And then over time, the price continues to consolidate and that liquidity gets bigger and then the price action starts to harvest that liquidity. So it's a pretty simple mechanism. It's. What's funny is the markets are extremely simple. They're not, they're not overly complicated. What happens is it preys on our impatience and our narrow sightedness. That's what it preys on. So as liquidity begins to build up, then the collective algorithms and market makers, they start harvesting that liquidity, as you can see here. And then when they harvest, so these are long. So when they are liquidated, they are forced to sell. So they are selling low. And then when they get enough inventory from liquidating the liquidity, they go back, start harvesting the short side, this side, and these shorts are forced to buy. So these are selling low and buying high. That's the opposite of what you're told to do. You're supposed to buy low and sell high. Well, the market makers and the collective algorithms has these locked in traders selling low and buying back high. So if you can see, it's a simple game. They get their inventory, they push it up here, and they sell it off up there over time. It's a very simple strategy. And what's happening in here is it's kind of like a betting game here, a casino. All these traders are making bets in here, in this chop, and they're getting added into this liquidity above and below. Half the people are saying short, have. The people are saying long. And it just continues to build up. And this action Is so it's so good it tempts you because you're looking at it. If you're a bear, it looks, it can look bearish and if you're a bull, it can look bullish. It preys on your bias. And no matter what your bias is, the market will make it look like that. And then you get added into these pools and then you get liquidated. So right here is a heavy concentration of shorts that have been building up on this price action over time. Here is building those shorts. And the market appears to be going at least for this intermediate area right here, which typically it doesn't do right away, but it's so close to the key level that they're just going to probably take that and then we may get a pullback and I don't expect it to be a very big one, but we have gone up from the low here over 40%. So we are due for something actually. You know, we're all bulls here, we're all very bullish. But it would be very healthy to get a 10% correction so we can have more health on the uptrend as we continue to liquidate here. We'll continue to take out this pool here and it would just be very healthy to have a, to have a little pullback before we continue higher. Because if we continue on this, the longer we. Sorry about all the jumping around, but the longer we stay on this trend line here and we just keep going up, the deeper the correction. So I don't, I don't want a deep correction. So it'd be better to get that little correction over now so we can stay on schedule, stay on the power law.
What is, what is our a correction that you see from the chart?
Well, this would be my corrective targets. We've already taken out all the internal liquidity, right. We have level liquidity up here that we haven't tapped yet. So the eternal, usually when you take out the internal, that's when you get it right. So we've done that. So that puts the pullback in play right now. So let me show you the levels. I'll just back off some of the back down to the 25. 25 is very good at showing you the key levels. Right. So as we were going up and terminating these levels and that's why liquidity is such a market making. And the, the algorithms, they're very efficient, right? So as they were terminating the shorts, they were simultaneously building alongside liquidity so they can come back. It's a two, two way action, right? So what I'm looking at here is when we pull back this, this liquidity pool will continue to go this way and this one will continue over. So this one is a high, high probability of being taken. So the bottom of that pool is 100k. So in a bull market, we're in a bull run right now. We're in a very bullish uptrend right now. So pullbacks are typically very short. So that would be your perfect bounce point. Liquidate this first level and then continue on. I. The probabilities are much lower. To get to these lower levels right now, we'll probably take them out in the bear market phase, which is after 200 or 180. So right now, to answer your question, Geo, I'm looking at this pool right here. Any, any time now. So, you know, that's in play. Back to 100. That would be very healthy. And then we keep going.
Good to know.
Yep.
Yeah. And I like the fact that, yeah, we start to see some, you know, that the next big red. Yeah, it's here. And then if we break through, we go all the way to.
Yeah, there's a, there's a, there's a huge amount of it right there. And what's happening right now is this price action is actually being fueled by shorts being liquidated, because when they're liquidated they have to buy. So that's actually just sucking like a vacuum. It's just sucking that price up right now because there's not, there's not like a lot of open interest is actually going down. But it's this, it's this liquidation that's driving the price right now. Yeah, yeah.
And once you're done with that, then you don't have a lot of fuel, you know, unless.
There are a lot of institutions hanging out right down here. Yeah, there's a lot of institutional demand here at this liquidation level here. So they're the big, the big players are looking to buy back in right here. They're not chasing this, they're looking to get.
I do like the idea that we are above the hundred thousand, you know, psychological level.
Yeah.
Because that means that we don't really need to go too much lower than that, right?
No.
That we could stay above that and still get plenty of liquidity.
And there's a lot of demand here at this 100k level. There's institutions waiting on this, this correction so they can continue to push it up.
Yeah, yeah.
What's interesting is that, you know, when, when sailor does his post and everyone's like why. Why didn't that move the price? You can see what's actually moving the price is a. Is a buildup of months and months and months of orders that are then executed simultaneously. Bank. That's what's driving the price. That no single move is doing it. It's actually. It's kind of. It's deterministic in a way. Right, but it's deterministic over only the last sort of three, four months is that that liquidity builds up on either side. It's got to go one way or the other.
Yep.
It's really interesting to see what's moving it.
But, I mean, people just need to watch our previous episodes because it's. We predicted it, you know, we. We're there telling these things. Go and look at the previous episode. I mean, Marcus was telling us exactly.
What was going to happen because.
And it did happen, you know, because once you. Once you read that is information, it's pretty clear, you know, I mean, nothing is 100, you know, but it gives you really an edge, you know, it gives you. It's a map. It's a map of Italian.
And you can see what the algorithms are doing. It's not one algorithm. There's tens of thousands of them. This is an ecosystem like an ocean, and they're predators and they're prey. You know, if you're on the wrong side of this, your shrimp, your barnacles, your small fish, and you're getting eaten by barracudas, mako sharks, great white sharks, killer whales, everything's in there and they do their thing. But it makes this. It makes the ecosystem work. And it's very clear that their algorithms that are harvesting these positions. Super clear. It's moving right now as we speak. Like, look, right now, it's actually being sucked into that liquidity right now as we speak.
Right, sure.
And that comes to, I guess, the logic that we're implementing in our own trading strategies for Minotaur, and they were all using personally, is a combination of Marcus's understanding of how the markets work and how they're driven by liquidity. This is how Marcus helped us develop the algorithm to where it is today. And then we're using Giovani's kind of macro framework.
Yeah.
To trade within those ideas that Marcus has helped us determine. And then. Well, really, that's the reason why the algorithm is able to get such good returns, because it's based on, you know, like Giovanni said, like we predicted it because this is how we believe the markets function. And then we create an Algorithm that exploits the very ideas that we have that are working.
Right. In a world driven by algorithmic trading, there's tens of thousands of algorithms. Then it only makes sense, it's intelligent for you to have your own algorithms to correct compete against those algorithms. So it's all driven by algorithms. 99.9. Yeah.
And we can have a look at. Just to compare today, let's look at this price action. Let me share my screen and let's just have a look at the most recent performance of the algo. Just over the last seven days. And you'll see, you'll need to. Maybe Marcus, you'll be able to talk through this.
Yeah, yeah, let me, let me do that.
You can show how the algorithm now is, is on a, on the 15 minute. Taking advantage of the moves.
Yeah, here we go.
There it is just constantly working. Yeah. You know, one of the, the benefits of the algorithm is it doesn't sleep, it doesn't eat, it doesn't have emotions, it doesn't get tired, it's not bullish, it's not bearish. It's always on, always waiting and it's taking the positions that are accordingly to its programming. It doesn't miss. And that's the magic. Yeah. Very beautiful entries. Yep.
And these take profits. Look at these. Take profits here.
Yeah, that's what it does. You know, it. It's in rhythm with the other.
And I want to add because today I was watching, you know, there are a couple of people that they fall online because I think they have, they are good, they have talent, you know, but you know, they take enormous risk. Like I will not make any name but they saw somebody was the open. It was. He had a good intuition. He understood that we had at this run up leg, you know, for whatever reason, the global liquidity etc. And he opened like I think from what I understood it looks like a 20, 30 pair of even more leverage trade. I mean he made a ton of money, but he could lose it all, you know. Yeah. And, and this, he has a big following, etc. I mean I don't say anything negative. He's. He's a good trader. But you know, it's a different type of approach where we are not disposing ourselves to these crazy risks. And still we are getting over a long time a pretty good return. You know, that is one of the things I want to emphasize. We focus because I have, you know, I have a friend, Dario, he's like a degenerate and he's calling me, can we push it, you know, to make two times more, four times.
Yeah, you can for a while. Yeah.
Till the wheels come up. This is what's interesting is that do you want an institution grade trading system or do you want to open up a 30x level leverage position and. And roll the dice? You might as well go to the casino. Like it's fine. People make money doing it. But that's the thing about cryptos. Everyone sees that what we can provide you with is an institutional grade trading style that's completely algorithmic and 100 hands off the average person cannot beat this, this system. I would even argue that 1% of all traders probably can't beat this.
I can't beat it. I can't beat it. I try. I can't beat it. We can't.
I mean it can be by luck.
Well, maybe.
One, one trade out of 25. I can beat it online.
Yeah, yeah.
But not over.
And then you can risk to lose it all, you know.
Yeah.
And, and so that is what we try to focus on to and deserve your capital and get an edge anyway.
Yeah. And this is why Citadel and is managing billions and trillions of dollars and degens are making trades on Twitter. Because you can't trust discretionary style trading or just ta in this environment. It's too sophisticated and it's moving in a way that most humans can't wrap their brain around. So.
Correct.
So you know, this is the edge that you can get. And I think we've got probably the best product out there that takes advantage of not only the volatility and the behavior of the market than Marcus explains, but we're able to incorporate the ideas of Giovanni and I think that's very, very unique.
Right. And just to add to what you're saying, Costa, one of the things you have to understand is if you're a discretionary trader, you are a caveman. You are a dinosaur. You're on your way to extinction. Because you have to understand that algorithms are creating this volatility. The thing that I showed on the daily chart is happening at the 1 minute, the 5 second, the 5 minute. The algorithms are pushing the price all over the place like this because they're creating liquidity and harvesting liquidity at all time frames. Matter of fact, on the macro scale timeframes is even greater volumes. And if you're trying to do that with a discretionary, because a discretionary trader, they, they make a position with a stop loss and a take profit. You're kind of like playing in a casino where you pick the number on roulette. And hope your number gets hit. That's not going to work. You need a system to where it doesn't matter what the market's doing. You have the equipment, the bandwidth, the structure and the amount of margin to be able to cover all angles. That's what these algorithms do. And you know, if you're doing that, you're not going to last very long. The casino is going to beat you. Basically.
One of the things that really surprised me about the algorithm is how well it finds these local bottoms and tops. And that's really, it's.
It's trading in rhythm with the other algorithms. Yeah, there's a. There's an algorithmic warfare going on with tens of thousands of algorithms firing orders. And this algorithm knows how to trade in harmony in that environment. You know, sometimes it gets front run by quicker algorithms, but that's okay because our algorithm, it doesn't eat, it doesn't sleep, it just patiently waits until it's. It's target is hit. And it hits it every time.
It's amazing.
It is, it is.
Costa, we are going to have. We all going to the conference, so if you want to meet us, we will be there. I will be there. I will mostly hang out around their minotaur. We are going to have a booth over there so you can find. But I let Cost explain because they can tell us.
Yeah, we've got the whole team coming to Vegas. Myself, Sebastian, the cto, Marcus. We're also getting some of our specialist team that basically do all the conversations. You know, when you book a call, we've got Matt and Josh that take those calls with our prospective clients, and everyone's going to be there. We want to basically answer your questions, do demos and meet you in person. You know, a lot of these, a lot of the products out there, you know, you never see the face. Half the reason why you can't trust a lot of things is because you never meet the person behind it. There's no transparency. One of the things that we do, which Giovanni does, is that, you know, we put ourselves out there, number one, but second, like, we put our money where our mouth is. We're running our own money on these algorithms. You know, Giovanni has. I know that you've been watching his ex post, but he's like.










