Minotaur Accumulator vs Liquidation Heat Map - September 2024 Market Update
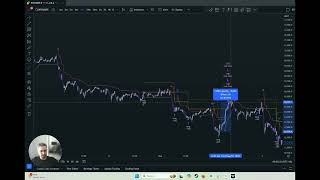
Sebastian from Minotaur Trading Systems shows how their Bitcoin trading algorithm performed during September 2024 volatility, with liquidation events hitting $206M, $63M, and $253M while the algo stayed profitable. Layered entries and trailing stops protected capital when retail accounts got wiped out.
Questions this video answers
15-minute timeframe.
$206 million in liquidations.
About $63 million in liquidations.
$253 million in liquidations.
Around 25%.
Chapters
Foreign. Sebastian here from Minotaur Trading Systems. Just want to give a little market update today on how our algorithm has been performing over the last couple months. And I just want to show some comparisons relative to the Bitcoin liquidation heat map. So I'll explain everyone how this works, why this is important, why this is relevant and why I'm showing this to you. The main reason being is that over last month and a half, two months, we've seen pretty rapid and violent volatility in the cryptocurrency markets. We've also seen quite a lot of volatility in a lot of financial markets, stock markets, commodity markets, you know, all sorts of different markets have seen massive volatility due to the overall macroeconomic kind of mini recession we're seeing at the moment. And we've seen some pretty violent down days. Now the reason this is important is to understand that in these environments, especially in FX and stocks and things like this, a few percent move to the downside will liquidate a lot of accounts, especially accounts that are over leveraged. And in forex and in stock markets due to the fact that there's not the greatest amount of volatility, you need quite a decent amount of movement to profit to the upside or to the downside. The reality is, is that people over leverage their positions and they get liquidated. And in the stock market you could see something like that happen the other day, or in the FX market the other day with the JPY ticker that basically you can have a 3 to 5% sell off and your account get completely wiped. So I just want to show you guys this chart here, because this explains how liquidations work and it actually shows you exactly how much money is getting liquidated in dollars. So if we look at this chart here, as we can see, crypto has been pretty wild. We had a big run up to start the year, we kind of consolidated going sideways and now you could say we're I guess on the way down a little bit. But I still believe the overall macro economic direction is upwards. But what you can see here is the chart and what this indicator at the bottom is showing you liquidation. So if we come here to around 67k, we can see here on this red candle, if you have a look at to the right hand side of the screen, at its peak on this day, there was $206 million in liquidations, meaning $206 million lost. Now I want to bring you back to our overall chart here and show you what we were doing on these days during this Intense volatility. So as we can see running up, we actually closed a position here. Our algorithm reset. This is our live algo running on bitcoin on the 15 minute time frame. So this is all live active data showing you how it runs. So what we're gonna see as the market's moving sideways, we take our first entry, we trail stop into profit. And as the market moves sideways, the algo is gonna take advantage of this price action really, really well. So this is pretty common. We're gonna move sideways, market's gonna move up a bit, we're gonna take profit. But what happens when the market starts to go down? So we're sitting at around 67k. The market falls already on this fall down to 66. We would have seen some decent liquidations. We place our first entry only using a small portion of our capital so we don't over leverage our positions. We effectively manage risk and we also effectively spread our capital across the market. So what this means is we can absorb massive dips in price and still have only actually allocated a portion of our portfolio to the market. So this is very, very understanding. Efficient use of capital as risk management. A lot of people just, you know, think that rudimentary take profit and stop loss is all you need in these markets. Is not true. You need to be efficiently managing your capital and efficiently dispersing it as the market gets more volatile. So as we can see, the market's starting to have a really decent sell off now. Now we're down to 63k, right? So we've already seen a big drop in price, around 6%. And what actually happens here is we continue to layer in, we get a nice little rally and we take profit here. So we made money on that move from 67 down to 63. Just to show you guys, by the time we hit 63k, which is about here on that day, not massive, but about $63 million in liquidation. So we made money while the rest of the market got liquidated. This is why this is important. But what actually happens is what we get some sideways movement, but the market sees a really violent sell off. So once again we enter Here at around 67, the market starts getting a really, really bad sell off. And this sell off actually ended up being around 25%. So as we can see, if I just scroll out the market from here, we made our first entry at 67, now we're at 62. We've already seen a 10% sell off here. So there's a lot of liquidations going on. In this period, we're just effectively layering our capital into the market as we go here. And as we can see now, we laid into these positions, the market ran up, we took profit, right? So once again, while the majority of the market has been liquidated, we're making money. This isn't, you know, me saying, oh, look at us, and I'm happy with people getting liquidated. I'm not, I'm just trying to explain that the vast majority of retailers don't have the emotional capacity to trade correctly. Therefore they over leverage their positions, they try to grow their accounts quickly and they get liquidated. So it's important to understand that our algorithm is effectively managing capital in these massive downturns. Now, we took profit here, our algorithm reset, we made another buy here, and look what happens again. We get a huge sell up here. I mean, look at this. Let's just track this here and then I want to show over on the heat map again. So now from here to here, we see a 25% sell off. And it's important to understand, right, we are not martingaling our capital into the market, doubling down every bit and just hoping that's going to work. Because I'll be blunt with everyone on this video now, Martingale doesn't work either. You can't just hope and pray and, you know, double down your capital each time the market falls. Because I mean, in an FX market you would have seen the majority of people get liquidated after a 3% drop. We're seeing literally a 25% drop here. And what I want to show everyone now is the liquidation heat map because we were at 65 and we dropped to 49 in a matter of two days and 22 hours, which is pretty crazy. So let's have a look at what happened, right? We ran up to 65 here, all absorbed this dip down to 48. Let's take a look here. $253 million in liquidations, guys, $253 million got wiped out in that position. Our algo was calm, relaxed, poised. Using maths, using statistical analysis, using machine learning, using data. We're just simply placing positions at the right time, efficiently managing our capital, not being emotional. I mean, by the time we hit the 25% dip in the market, we'd actually barely injected 50% of our capital into the actual market. So we hadn't even used all of our funds yet. What we saw after that simple rally to the upside, take a look at that. We trail stop out of every single position we entered and make a really nice profit. Now, what's important to understand here also is that don't forget we made our first buy at 65. The market sold off massively. We sold at 56 and took profit going long the whole time. So we actually bought the top, sold the bottom and made profit. Now, a lot of you might be asking, how is this possible? How does this work? We're going to provide a link at the bottom of this video so you can book a call with my team, my specialist, and you can understand why this is so powerful, how we were able to buy the top, sell the bottom and make money and still be trading the whole time. So if you got liquidated in this recent period or, you know, you lost quite a lot of money, or you're just simply looking for a system that's able to absorb 25% drops and profit, this system is for you. And as we can see, as we continue to trade now, we move sideways again and we're just scalping this sideways structure. Long trail, stop. Long trail, stop. Long trail, stop. That's it, guys. So I wanted to do this video to explain to everyone how our algorithm makes money while the rest of the market loses money. How we're able to do things in the market a lot of people aren't. And also just to show you the importance of understanding how much money in the market is being liquidated in these giant drops and how many people aren't prepared for these scenarios. So, once again, guys, Sebastian from Minotaur Trading System signing off. And hopefully this video gave you a lot of insight. If you want to know how this system works in deeper detail, please book a call with our specialists and we'll run you through everything. Thanks for your time, everyone.










