Create Node-RED App on IBM Cloud to Send Alert Tweet Based on Data from an IoT Device (Part 2/2)
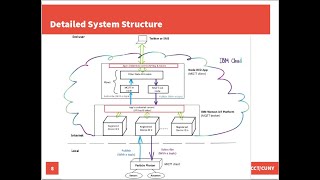
Richard Li walks through deploying a Node-RED app on IBM Cloud, connecting a Particle Photon sensor to Watson IoT Platform and Twitter, then configuring MQTT and Twitter nodes to post alerts when the device sends data. You'll set up API keys, bind services, import flows, and test the full pipeline from hardware to tweet.
Questions this video answers
Default 128 megabytes; configurable between 64 megabytes and 2 gigabytes.
Port 1883.
At least 100 characters.
<organization-id>//messaging.internetofthings.ibmcloud.com (organization id appears as the first part of the host address).
Organization ID, event ID (topic), data format/properties, and QoS; client IDs and credentials (API key/token) must also correspond.
Chapters
Now we have the app been created. But before the app can fully function, there are several other steps we have to go through. Actually the instruction is listed right here. We need to deploy your app. So you can simply click this button. Deploy your app. Right now we are on the deploy your app page. On this page we need create a API key for the Loaderata app. You can simply click the new button here and then we are here on the create a new API key pop up window. The key will be called API key for blah blah blah which is the notorator app. You may notice I used underscore in the original Loader apps name. But here all the underscores are skipped. But that won't affect you to realize that is the key for your Node Radar app. Another thing you can do is check out check this item here to save this key in a secret store for reuse. Basically what this part is doing here is to store your API key on a secret store service on IBM cloud. And then we allow IBM Cloud to store all the API keys for us. In the future we can easily retrieve the API keys from the cloud. You may want to pay attention. Here is the region. I suggest you choose the same region as your Load Radar app. What I used is Daedalus. And then here, let me provide a name for this secret store service. I'm going to call that my secret store service. For iot labs. Alright. And then click ok. And here we go. API key has been created for for my Loaderata app. The next thing you can configure here is the memory allocation per instance. By default it's 128 megabytes. You can change this value between 64 megabytes to 2 gigabytes. Let me increase this one by to 256 megabyte, which I think is more than enough for the label we are doing here. All right. Another thing is the region. We also choose Daedals and then over here you can see the host. Actually that's the host address of your Node Radar app. The full URL will be this.mybluemax. in the future we're going to use this URL to directly access our Node Radar app. Okay, we're done here. And then just click create a button here. Right now IBM Cloud is working on the continuous delivery configuration for us. Let's wait a little bit. Okay, success. Your DevOps toolchain has been created. The developer tool, the DevOps toolchain is automatically provisioned by IBM Cloud. Okay, all right, everything looks good. Let's move on to the next step. Step 9 Connect the newly created Node Radar app with the IBM Watson IoT Platform Service Instance, which you use to register your IoT device. By this step, we're going to combine. We're going to link up to Loaderata app together with Watson IoT platform. How we do that? Very simple right here. I mean this one a little bit bigger. Just click this link here. Click existing service. Here we go. The Watson IoT platform service we created before. To register the particle photon is right here. You click this one and click Next and then success. You can see the Watson IoT Platform Service right now. It's bounded with this Node Red app. Okay, We're done with creating the loadedrador app and then let's move on to the next step. Start the Loaderata App editor on IBM Cloud loaderator App Editor is a graphical programming tool that we're gonna use to edit and create the details for the Loaderator app. I have two notes here, but let me open up the app editor first and then we're gonna come back to these two notes later. How to open up the App Editor. You can just simply go to your dashboard on IBM Cloud. On the dashboard right now you should be able to see the Loaderate app has been listed here. We have one app listed here and all the other associated services with the app. Let's open that up. You can see your loaded app is listed here under the App section. And under the Services section you can see all the services associated with your app are listed here, including the Continuous delivery, Watson IT Platform Secret Store Service and Cloud database under Cloud Foundry Apps section here you will see your app's name is also listed here. That's the link we're gonna click to open up the App Editor. Pay close attention about the status of your app. If it's not start yet, you can simply just click the pop up menu here to restart the app. Okay, let me click the app's name here to go to the apps landing page. Here we go. And over here you can see the status your loaderat app is running and then click the link right next to it. Visit App URL and here we go. We come to the loaderat App Editor page. Pay attention about the URL here. That's your loaderata app URL. The hostname here is the app's name and the domain name is mybluemix.net Click Next and then you come to this page to set up a username and password for your app. Make sure to use a strong password. Of course you have to memorize this or keep a record of the username and password and then click Next. And here there's a very brief introduction about how to install additional nodes on Node Array. Click next and on this page you can see you can actually change the setting for the username and password just in case if you forget or lose it, you can just go to the Cloud Dashboard, open up your app page and then changes to environment variables to reset the username and password. Okay, and then let's finish this and the Loaderata app editor is going to come up shortly. Here we go. That is the entrance page of the Load Rate editor. Click this one to login. Type up the username and the password. Just create it to log in. Here. Right now we are landed on the Load Radar App editor. The editor here is a graphical programming interface where we can create the details for the Loaderate app. It's a graphical programming tool, which means we don't really need write that much detailed code. Before we jump into the details here, let's get back to the two notes when we talk about step 10. Note one. Right after the username and the password just been created, attempted first time login to the editor may fail. Simply wait for a bit of while and try it again. Actually this occurred to me a few days ago. I just created another new Nordew app and the username and password to log into it. But the first time logged in I tried failed. I thought that was because the username and password had a problem. So I reset the username and password but it still cannot login later. I just wait a little bit and then try again and it worked. So if this kind of thing happens to you too, just give IBM Cloud a little bit more time and wait a little bit. The second note is here. If the username and password are lost, you can manually reconfigure them by setting load RAID username and load RAID password environment variables in the app's runtime status page. That's what I mentioned before. Even though you forget or lose the username and password to the load rate editor, you can reset them manually. Alright, let's move on to the next step. Step 11 make yourself familiar with the Load Rate editor squee and features. Create a load RAID flow. You can refer to my example Load RAID flow posted on CityTech Robotics Research Lab website. Here's the link. Before I show you the example flow, let me quickly walk you through some main and important features of the loaderat editor. On the left hand side you can see there are a lot of nodes. There are category into different groups depending on the use. You can simply drag any node you want to use into this workspace which is called flow. If you have a group of nodes being connected together, that's flow. You can click this plus icon here to add another flow into your workspace. On the right hand side we have this big deploy button. Here you can click this button to deploy all those flows in your workspace. You can also select Modified flow or Modified nodes to be deployed only. And here we have this drop down menu. You can quickly go over each of this menu by yourself. But let me point out the most important things here we have Import and export. You can use export to backup your flow. You can use the import to import some example flow into your workspace. And you can click this configuration node menu to configure the selected node. And another thing very important which we're going to use later is here Manage Planet. We're going to use this menu to install some additional node which is not loaded with the default node rate editor. Another thing is the setting. You can check it out, see what kind of setting you can do with the load rate editor. Another thing I want to mention as the view tabs we can click this node information tab to see some detailed information regarding the select node. The next tab is the debug message. Click this tab. You can see the debug message being displayed here. We're gonna use the debug tab here later to debug the flow. Alright. And then let's get back to my website. To get the example node radio flow, Go to citytech robotics. Go to the iot course webpage. Scroll down to the weekly schedule under Lab7. That's the one we are doing right now. Lab7 notewraider app to tweet alert message according to remote sensor readings. Right under it we have example node radar flow for generating Twitter alert message. Open that up, copy paste the entire thing. Basically this is JSON format for the loaderata app flow and then get back to here. Let me delete this one and then import the example flow. We just copied post right here and then import and I place all those notes from the example flow. Now here we go. That's the example flow. But we have to make some changes to the example flow. Because when I created the example flow a couple years ago I used a Node Dakota IBM iot Yum. And right now this node is not being supported anymore. So we have to replace this one by new MQTT node. Alright, that's actually the step 12 replace the IBM IoT node in my example flow by mqtt in node and then set up that node correctly. Tips how to set up the following field in meqttd yin node we have to set up the server client id, username, password and topic for this single node. There are several important parameters we need to set up. Okay, let me quickly show you. First of all, deleted the old IBM IoT input node and replaced by the new mqtt input node where you can find that it's listed right here. In the group of network there are two mqtt nodes. One is for input, the other one is for output. If you place the crosshair right on top of a node, you can have a pop up window to view the brief description about that node. The mqttd in node connects to a mqtt broker which is the IBM Watson IoT platform and it subscribes to messages from specified topic. That's the node we're going to use. Namely drag and place this one into the workspace and connect it up. We need correct configure this node to enable the Load Radar app to be able to connect to The Appian Watson IoT platform and software sensor data message. From there, Double click this note and on this editing page we need set up several properties here including server topic QoS. I have detailed instruction here to show you how to set up the following fields in mqtt in node including server client id, username, password and topic. Let me go back to the Node RAID app editor page to show you how to configure each of them. First of all, the server. You click this icon here to open up the editing page for the server itself. Actually I already finished the configuration for the now let me open up another flow and show you what I did. Let me import the one already finished. Okay, here we go. That's the finished the flow for the Loaderator app for this lab. I already replaced the old IBM IoT input node by the mqtt node. This actually is a mqtt input node. Let me open up and explain to you how to set up each of those properties. The first one is server address. What is this? This is actually your IBM Watson IoT platform URL the server your Watson IoT platform service instance URL same as MQTT host address used in Particle Photons code. So you can simply go to your Particle Photons code and then copy paste the mqtt host Address. Now we place this one into here. If we look at the detailed MQTT host address, you can see it's made by your organization id:// messaging.inertofsins. iBMCloud.com that's the server address. The next thing is the port number. We are using 1883 here for loaderat app. This number got matched with your Particle Photons code here. Because we are not using any tos so. So we have to use this same number for everything including IBM Watson IoT platform and the particle folder here and the Loadervader app here. Alright, next thing we need to set up is Client id. How to set that up? Every instruction here. The client ID is MQTT Client ID of your nodewaytr app. Gotta be in the format as a content organization ID app ID. Note, both your IoT device, the particle Photon and the Nodorator app are MQTT clients. The MQTT broker IS IBM Watson IoT platform. The MQTT message will be transferred through this broker. So let's set this up. We have a. And then the Organization id. I think I need to update the Organization id. By the way, how can you find out your Organization id? It's right here. If you go to. Your IBM Watson IoT platform page, you can have your organization ID right here. Of course you can look at your MQTT host address. The first part is your Organization id. Let me replace this one here. And then the Apps id. Basically you can name anything you want. Let me update that one to something called IoT lab demo. Alert. Okay, and then let's move to the next one. The security. We have two properties needed to be set up. Username and password. How to set them up? Here I have the instructions here. The username I got to be in the format as a organizationid API key. The password will be your Node RAPS authentication token where we can get these two pieces of information. The API key and the token. Let me get back to the Load RAID app page here to explain to you who is going to use this security information here and where this security information will be presented. To keep in mind, what we are doing here right now is to set up the MQTT input node for the Node Radar app. In other words, the Node Radar app will use that security information whenever it tries to get connected to the IBM Watson IoT platform immediately. You can understand the security information got to be configured on IBM Watson IoT platform here. How to set that up? You can just simply click apps here and then generate An API key here for the Node Radar app. You can put some simple sentence here for the API keys discretion. Let me put something here as API key for the load raid app NR app 1 LT lab demo to IT alert and you can keep the API key expiration date off, which means this API key never expires. And then click next. And then we have the row to set up for the API key. You can choose visualization, data processing application or some other things. Let me choose a standard application and then generate the key. And here we go. That's the API key and authentication token registered on IBM Watson IT platform. If you give this security information to the Load Radar app. And then of course every time whenever node loaded app presents this security information to the Watson IoT platform and then Watson IoT platform will allow the loaded app get connected with it. So let's copy paste and keep a record of this one and API key open up. Put together with your device credential information here, The API key and also authentication token. All right, and then we generated the security information for the loaderata app and then we can just use this information into the MQTT input node security here, the users here look, the format exactly matches what we required. A organization id and then the app's API key and let me copy paste the password. Okay, here we go. We are done with the security setting. Now how about the messages? Actually you don't need to do anything over here. Just leave it as default and pretty much we are done with the server property configuration. Let's update and we are done with this part the server property and the next one is topic. How we set this up after the instruction here for the setup we can use something like this LT Device tab ID Device ID event event ID FMT format and then we use plus here. This plus is actually the wildcard character which means we are going to subscribe an event with this event ID in any format. JSON, string, whatever. Okay, so let's put this one into here. That's what I have. And then let's double check to see whether we needed to update this topic. I have LD2 tab and then plus I also use the white card here for the device tab which means I'm going to subscribe any topic coming from any device tab and then the id. Let me update the device id. I only want subscribe the event topic coming from my photon one and the event. Let me set it as one here as my test event. That's the event id. I'm going to subscribe this is very important. You have to make sure the event ID you used here match with what you use in your code. The event ID here in your particle photon code you're going to send a sensor data with this event topic called mytest event. Of course on the Load Radar app you have to subscribe same event with the same event id. My test event here under the format over here I use wildcard which means I don't care what the format being sent out, I'm going to subscribe over here in the code I use JSON. Of course if you want you can also change this one, replace this wild card here by JSON. But let me leave just like that. Okay, and then next one is QoS. The QoS you set up here got a match with the QoS you used in your particle photon here. All right, look, it's matched then pretty much that. And then we are done with this MQTT input node. Look, it's not that simple to set this single node up, but after you get familiar with you will know how to set up. Okay, let's click and then we are done with this MQTT input node. Let's move on to the next step. 13. Login to your Twitter account Go to Twitter developer page to apply for a Twitter Developer account if you don't have one when you apply for the Twitter Developer account, no access to standard API is good enough. So what we are going to do here in this step is to apply for a Twitter developer account and then we're going to create a Twitter app and then we're going to link the app with this Node Radar app and we can send Twitter message. How to apply for a Twitter Developer account if you don't have one? Okay, you can simply go to Google. Just type up how to apply for a Twitter developer account and you will see a tutorial page written by this company called xtd. I have detailed instruction showing you how to apply for a Twitter Developer account. When you apply for the developer account you have to answer several questions. For example, describe your intended use of the Twitter API, how will you use the Twitter API or Twitter data and. You have to provide your Twitter id, so on and so forth. So you can look at this tutorial and get to know how to apply for the Twitter Developer account. Alright, let's move on to the next one. Yes, you need to answer all the required questions when you're applying for a Twitter developer account most time your application will be approved very quickly. Alright, that's this step. Let's move on to the next step. Step 14 Log into your Twitter developer account and create a new app. Tip on app details page, use your load red apps URL for website URL and callback URL. Let me show you what that's about. First of all, let me go to my Twitter developer account. I think I have the page already open up. Yes. By the way, here's the landing page for applying for the Twitter developer account. Okay, I already have RL1. So over here, let me just quickly show you how we can create a new Twitter app. In this drop down menu, click this link here Apps. And then here we come to the app page. On this page you can see I have already created two apps. The right hand side, there's a button here. Click to create new app. Here's the page to create a new Twitter app. First of all we got to provide a name for the app. Let's call it Twitter app for another app one. Okay, that's the name for this app. And the next section here you have to provide a brief description for this app. Let's put on something like this Twitter app to be used at node red app NR app 1. For posting alert tweet. Okay, let me make this bigger. You can see what I put there. A Twitter app to be used by the notewater app for posting alert tweets. A very brief description for this Twitter app. Okay, the next One is website URL, which is required. And there's another URL called callback URL. What URLs we have to put here your notivator apps URL. How we can find that out? Let's get back to your loaderata apps resource list page here. That's the page and we have the link here. We click the link before to open up the loaderata app editor. So copy paste the link here. If you want, you can click this one and verify. Yes, here we go. Okay, that's the link. You can of course you can go to the open the load rate editor page here to get the URL for the load rate app here. They all are the same. Let's put this one into the Twitter app. There you go. The website URL, it's here. And then the callback URL is the same URL for the callbacks. Okay, we're done with this part. Let's move on. And over here you can skip, skip all these sections here because they are not required. And then we're down here, the last part, you have to put something here to explain how this app will be used this is required. The only thing you have to pay attention is this. You have to put in at least 100 characters here. It's not a retrieval, but you can simply type up something like this. Let me show you a trick. Let's say this one is for testing, okay. And then you can repeat this one again, again, again, again, again. Make up the hundred characters and then let's click Create. Let's see if this one works. Here's the terms you can review and create. Bingo. Application created. It worked. Okay, and here we have the app pin created the next. And the most important thing regarding that is to keep a record about keys and the tokens. Let's click this page. Alright. And now we have the API key API secret key being created already automatically. The next thing we need to do is to generate access token and access token security. Click this button here to generate. And we have to keep a record of both access token and access token secret. This is very important because later we're gonna use this one in the loaded app. Okay, let me copy this one and put this one together with my record for the device credential and API key for the nolavaret app. Okay, let me put something here. So Twitter app. Okay, The one just post here is access token and then let me copy paste the access token secret. If you want, let me copy paste the entire thing. Okay, there we go. Alright, you must keep a record because this will these two information will be only showed to you at once. If you do not keep a record right now, then later you have to regenerate them. Alright, let me close this one. And now also we need to keep a record about the API key and API secret keys. So let me copy paste this two and put into the record. The API key and API secret key. Let me put a separation line between. And put something on the top here device. All right, we're done with this step. Let's get back to the instructions here. I have the warning here. Keep a record of your Twitter APIs, your Twitter apps, API key and API secret key Access token Access token secret which we have already done. Okay, and then let's move on to the next step. Step 15 Go back to Node Red editor. Install Twitter Note. Insert a Twitter out node in the flow correct setup. I have a table here. Use your Twitter app's credential information to set up Twitter auth node, namely API key, API security key, access token and access token secret. Those four pieces of security information we created before to set up that node. But first of all we need to install the Twitter note, let's get back to Node Radar app editor. Actually I already have this Twitter out node here. But right now the editor recognize this one as unknown. Why? It's because this node is not coming with this editor by default. So if you go through the default nodes on the left, you won't be able to see this node, the Twitter node there. So it means we have to install this node manually. How we can do that? Go to the drop down menu, click the Manage palette and then if you search the Twitter node here, look, there's nothing here. This is simply just because this node, it's not coming with the editor by default. So we have to click the Install tab to install this node manually type up Twitter. Yes, here we go. You can see the notoriety node. Twitter is right here. Let's install this one. Click Install here and then verify and click Install. Right now the editor is installed in the Twitter node. Here we go, we have the loader installed. Let's close this one, get back to here. Now the node is recognized. Then let's double click this guy to edit this one. There are several properties. We have to set up the Twitter ID here. We have to put a lot of information here. Click this icon here to edit. The first thing we need to set up this note is your to put your Twitter id. Of course you know, assuming you know your own Twitter id. Okay, if you forget your Twitter id, you can go to your Twitter page. Okay, here's my Twitter id. Alright, let's get back to the load red here. Fill in the Twitter ID and then the next thing we need to put in here, the API key, the secret token, access token and access token secret which we already kept a record. Let's open that up and copy paste everything from here. The API key first and then the API security. And then access token and access token secret. Copy Paste each of them one by one and then here we go pretty much we are down with this Twitter output node and then we click the add and we're done. So we finish setting up the tweeter output node and then we have all those nodes in this flow correctly configured and we can double check, go through each of them and regarding the other nodes here, here, here, here, pretty much you don't need to change anything, you can just use them directly. From my example flow of course you can open up to read about particularly the switch node. What I have here is to generate something like if else statement, if the switch sensor reading in the payload is less or equal than 20 and then we do something. Or if it's between 80 to 100, we do something. We have two branches coming out of this switch node. Okay. And then we form two different Twitter message. If it's less or equal than 20, we generate a Twitter message. One say warning, sensor reading is low. And also display the sensor reading which is including the payload. So you put these two pairs brackets around the payload to actually display the value of the sensor. The sensor's reading is in the payload. You can change this part. Delete this. Warning, sensor reading is low. The current reading is payload. All right, let's connect it down. We got a. Oh, the last part here is a Twitter note. You can double click open up and double check. Confirm everything's good. Alright. And then let's deploy. And then deploy. Success. Right now we have everything being created. It's move on to the next step. We just finished step 15 here correctly set up the Twitter output node. Next step, run Photons code view data visualization inboard card on IBM Watson IoT platform. View Twitter alert message posted on the Twitter account. I have a tip here. Open a server communication tool such as Putty or Terra Term in Windows screen in Linux and Mac to view and verify the data actually being sent out from Photon. So let me go back to Photon's code and actually my code is running there still in my Particle Photon. So let me open up the screen and you can see what the data is actually being sent out from Particle Photon. Here we go. Particle Photon is connected to the cloud and data it's been correctly sent out from Photon. And then let's go to IBM Watson IoT platform to visualize. Oh because I haven't come back to this page for a long while and then the session expires already. Let's get back to the wild IoT platform again. Let's open up the board and card my demo board one. Here we go. The data is being correctly received and visualized by the the Boston IoT platform. Let's verify this is on the right. This is the actual data being sent out from the Particle Photon on the left. That is the data being received and visualized on Walson IoT platform. Actually this is the same as what we have done in the last lab Lab six and then how about the load radar app? Let's go to Twitter page Then let's see if any alert message being posted. Yes, here we go. We have warning sensor readings higher. Current reading is 10, Which is just post a few minutes ago. Let's get back to here. Every time when the data sent by Party photon is greater than 80 and then we will receive a high alert message. Let me delete the previous alert message message first, otherwise it's going to be duplicated. Okay, let me refresh. And then right now here we have 90. 90 will trigger a high alertness. 100 will trigger another high alertness. Let's get back to the Twitter page, see if 90 and 100 high alert message being posted. Yes, here we go. We have this new high alert message just coming. And how about low alert message? Because in the low rated app we set up whenever the reading is less or equal than 20, then lower alert message will be post. Let's get back to my Twitter page and refresh the page and see to see if there is any no alert message being posted. Yes, here we go. We have no alert message being posted. So it's running correctly. All right. Another way to verify the output of your Node Radar app is go to the Loaderator app editor and then open up the View tab, Open up the debug view, We show the sidebar here, we can click the tab, the debug message and then we can see what's going on, what's happening among these nodes. Now you can see we have this warning message being posted. No warning message if the reading is less or equal than 20. And then later if the reading is greater than 80. Between 80 and 100 we have a high alert message. There we go. And work. Perfect. And then look here. Right now we have these failed sliders showing up under this Twitter note. Let's check it out, see what's going on with that. Why this one report failure? Okay, I guess that failure was reported before. Okay, this is the latest time. You can look at the timestamp here. Okay, failure again. Look, here we go. That's the error. That is a very reason why there's no Rayna report failure because it said the status is a duplicated is because simply because this warning message is high alert message has been post on Twitter before here. So Twitter set up this feature. If it detects exact same message it's trying to be posted again, we're blocked. That will report this duplicate error message. So right now you understand why before we set up this callback, this error message is coming from the Twitter's callback. The Twitter reports this error message and then send back to this notivator app. And then that's the reason why we can see this error message here. Okay. All right. And anything else? Let me put everything together. You can see how this Thing works perfectly all together. First one, let me show you the data being actually sent out from Particle folder through this serial communication interface. And then the IBM Watson IoT platform will visualize the data through this board and card. Put them together, you can see data being correctly received and visualized. And then the LoaderRada app. Here we have data being received 30, 30 is here 40 being received by the Loaderator app. Of course the data is going through The Albion Watson IoT platform, originally sent by Particle Photon and then goes through the IBM Watson IoT platform and then received here in the Node Red app. Okay, and then let's get back to the Twitter page and you can see the alert message being posted. Okay, here we go. That's the entire nav. Of course you may run into some errors or some issues here I have a troubleshooting checklist. First one you need to check is hardware perspectives. We need to check the Particle Photon circuit. Particle Photons Internet connection. Make sure everything is fine. And then another thing you need to check is the Particle Photons code. Make sure the host address in your code is correct. Pay close attention to the organization id. Second thing you need to check is the device credential information in your code, including device tab, device ID, username token. Third one you need to check is the event ID and the data property. This one, these two guides. Imagine between your code and IBM Cloud, the Watson IoT platform, car and board configuration and also your load radar apps configuration. Among the three components, these two atoms got to be the same. The event ID and the data properties. The next one is MQTT payload. You have to check out your code. It's generating the correct payload. The third perspective you need a troubleshoot is the IBM Cloud. On the cloud we have two components there. One is the IBM Watson IoT platform. The other one is the Node Red app. For the Node Red app we need to verify the MQTT node. Make sure it's correctly configured. And also we need to check out the Twitter out node in the loader radar output flow. We need to make sure that when it's correctly configured for the admin Watson ID platform, we need to check out the connection security. Make sure it's correctly configured because we are not using any tls. So you got to make sure the configuration here is matched with the port number you used in your Photons code. The last part you need to check out is a continuous delivery pipeline in the developer tool chains. Make sure it's correctly staged and is up and running fine. Let me show you what that one is about. Go to your resource list and click your app here under the apps section. This is a summary page of your app and then have all associated services display here the Cloudant database, IoT platform and the container delivery. So you need to make sure this one it's correct and we have a tool chain we have delivery pipeline and the status here you should be able to see something say active or running and here I have a warning but it's not very critical. If you see anything not very proper then you have to troubleshoot here. Alright. Okay the next part I have here is some references I used to create this tutorial video. You can check them out. I refer to many official documents including particles, IBM WASM IoT Platform, IBM Cloud, IBM Developer Tutorials and the Twitter developers documentations and of course not red documentations. All right and I guess pretty much that's it and see you next time.
More from Richard
Create Node-RED App on IBM Cloud to Send Alert Tweet Based on Data from an IoT Device (Part 1/2)

Video Survelliance Autonomous Robot with Android - NYCCT Course Project with Dr. Li