Bioanalytical Method Validation of a Small Molecule in a Surrogate Matrix by LC-MS/MS
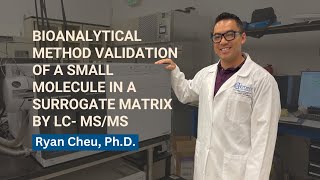
Ryan Chu walks through validating LC-MS/MS methods for small molecules using a surrogate matrix instead of real study samples. He covers the ICH M10 guideline, key parameters like specificity and linearity, stability testing protocols, and acceptance criteria for proving the method works when calibration and study matrices differ.
Questions this video answers
November 2022
Ryan Chu, Director of Chemistry at Emory Pharma
85–115% (80–120% for the LLOQ)
≤15% CV (≤20% CV at LLOQ)
Five replicates per QC level; two to three independent runs over several days with multiple analysts
Chapters
Hey, my name is Ryan Chu and I'm the Director of Chemistry here at Emory Pharma. I did my graduate work in pharmaceutical sciences, specifically focusing on drug metabolism. As part of my work and some overlapping themes with Emery, Pharma is having to do bioanalytical work. The topic that I'd like to discuss today is bioanalytical method validation of small molecules using a surrogate matrix, using LC Ms. Ms. The first question we ask ourselves is what exactly is method validation? So method validation really ensures accuracy and reliable results, right? It gives us the uncertainty of any method that we're doing. How certain are we of of the results that we're getting? Ultimately, method validation gives us the confidence that our method is appropriate and can produce reliable and reproducible data. In order to do a validation, though, you must make some considerations, right? What do we have to think about before we start? So those things are, what is our method purpose, right? What are we trying to do? What is the scope of what we're trying to do? What sort of regulatory guidelines do we need to consider? And I'll get to that in the next slide. In terms of method development, is our method adequately developed? Do we have a validation protocol with acceptable parameters, with acceptance criteria? Is our instrument calibrated? Is it qualified to conduct this type of work? Are the materials that we use, are they reference standards? Do they have certificate of analyses? What about these reagents? And then finally, for the analysts that are involved, are they trained and qualified to be conducting this work? We'll go through all of these considerations as more throughout the rest of this presentation. So the ICH M10 bioanalytical method validation was recently issued and adopted by the FDA and EMA in November 2022. Prior to this adoption, there was really no standard approach for comparing bioanalysis data, which makes the implementation of this regulatory document an amazing accomplishment in and of itself. What this does is it provides recommendations for the validation criteria that we must consider when we do bioanalytical method validation for both chemical and biological drug quantification. Following this guidance document is absolutely crucial in ensuring the accuracy, reliability and reproducibility of our analytical methods. Some of the parameters that we're considering and that we'll talk about today are listed in this box right here. They range from things such as specificity, selectivity, linearity and range of our calibration curve. Any sort of carryover that we see, how accurate and precise is our method. Parallelism. Why is that important? What is that recovery? What's our ability to actually recover this Analyte in these matrices. Dilution integrity, anytime you do pharmacokinetic studies, if you're not sure what drug you need, are you able to accurately dilute to get an accurate result? And then finally, four different considerations for stability in how your sample is either transported, obtained or processed. Before we get into the actual parameters, we need to talk about a surrogate matrix. So what exactly is a surrogate matrix? So a surrogate matrix is used to mimic the characteristics and compositions of an actual biological matrix, that of which you are interested in doing. This is very common and very typical of the work that we do here at Emery Pharmacy, but also very common and typical when the actual matrix that you're using is either difficult to obtain or difficult to handle. So a good example that we commonly deal with here is a matrix such as aqueous humor in your eye. This is a very rare matrix and pretty difficult to actually obtain. So a surrogate matrix in this case would be plasma, which is much easier to handle and much easier to obtain. The pros for this, again, is exactly what I talked about, where you have more volume for analysis. But the cons being there are different considerations for this different matrix, such as protein binding, maybe any ph differences or other matrix specific factors, depending on what surrogate matrix you decide. So the question that we're really trying to talk about today is validating a method that uses a surrogate matrix. What do you do in those situations? So this slide here is a very simplistic model of how we actually would conduct this type of sample analysis. So here we have a test compound in a biological matrix. So this is the actual biological matrix that the samples will be acquired in for however rare it may be. A typical sample preparation that we perform is adding an internal standard, followed by a protein precipitation step, a centrifugation, and a filtration prior to injection into one of our LC Ms. Ms. Instruments. Other types of sample preparation could include solid phase extraction, liquid liquid extraction, supported liquid extraction and derivatization. Other considerations that we talked about on our website for LC Ms. Ms. Analysis include different columns, different mobile phases and gradients, different flow rates, injection volumes, and column temperature. I highly recommend checking out our website emerypharma.com for more information about any of these specific parameters. So moving forward, we're now going to talk about each of those different parameters and how they actually can be applied when using a surrogate matrix for method validation. So specificity is the ability to differentiate and quantify any analyte you're interested in in the presence of other components. Within the matrix or right, we talk about these different matrices having different things. This is a way to sort of separate and distinguish your analyte from those that are endogenously in the matrix. Selectivity is the ability to assess this analyte in the presence of other components. Oftentimes with formulations, there's more than one component and not just the API itself. So in order to conduct this, what you do is you take both your matrix as well as the surrogate matrix and you undergo that same sample preparation. So in the example that I talked about, we did a protein precipitation followed by a centrifugation filtration step. Here's a representative chromatogram of what you would be looking for. So here we see our analyte and matrix. You can see that nice big peak there at about five minutes. Now when we look at our biological matrix or the surrogate matrix that we're using, we, we see the absence of a peak at that same retention time, again giving us the confidence that our method is both specific and selective for this analyte of interest. The next step moves to actual quantitation. So how do you accurately quantitate these samples in these matrices? The assessment that we do here is called linearity and range. What linearity is telling us is the ability to obtain a result that's directly proportional to, to the concentration of analyte. And that range is the interval between that low and high end where we're able to still maintain accuracy and precision. So the requirements per the ICH M10 guideline is to run this linearity and range assessment three independent times over several days with multiple analysts. The criteria is having more than six standards, having more than 75% of those standards falling within the accuracy limits of 85 to 115%. The exception being at the lower limit of quantitation or lloq where the accuracy is a little wider at 80 to 120%. Here is an example for how you would do this test. You would take your analyte or test compound of interest and spike it into your surrogate matrix. So not your actual biological matrix, but the surrogate matrix and undergo a sample preparation following that, you would then look at your accuracy of all of these different standards and make sure that they fall within 85 to 115%. With the exception of your LLOQ here, which has a wider accuracy range, as I mentioned, between 80 to 120. Your linearity would be demonstrated here with your range from x concentration to a high concentration and then the correlation coefficient being here, how well concentration and response are related. Another important criteria is carryover. So what do I mean by carryover? This is really a contamination assessment. So this is saying that any previous analysis that you've done, is there any sort of contamination that's going to affect the next run? So in order to do this, you actually run your lowest standard, your LLOQ followed by your highest standard and then immediately followed by a blank. What you're looking for is after the highest standard or what signal are you seeing in that subsequent blank. And the criteria being having the blank signal being less than 20% of that you see at the LLOQ. So again, you run your highest standard followed by a blank, and then this response being less than 20% of your smallest response, again indicating no carryover. So these are representative chromatograms of how you see our highest calibration standard and the subsequent blank, again with no signal. Therefore we do not have carryover in this example. Moving along, the next important parameter is accuracy and precision. So what are those differences? So accuracy is the closeness of this result to what it should be. Really, how close are you to what you expect to be? Precision is how repeatable that value is. So the requirements for this are are very similar to that of the standards where you have to run at least four different levels of these accuracy and precision standards. An LLOQ, a low QC, which is defined as three times whatever the LLOQ is, a medium QC, which is 30 to 50% of that calibration range that we talked about, and then finally a high QC which is greater than 75% of of the highest standard. The reason you want to have these QCs covering this range is so you have accurate representation across the entire calibration curve. The key here is that you must run five replicates at each level per the ICH M10 guideline, and that a minimum of two to three independent runs be conducted over several days with multiple analysts. The criteria is very similar to that of the standard curve. 85 to 115% accuracy, 80 to 120 for the LLOQ, and then for the precision, our coefficient of variation, meaning the standard deviation over the mean of those five replicates being 15% or 20% for the lower limit of quantitation. In order to do this, you take the test compound and again spike it in the surrogate matrix, not the actual biological one, and then you undergo your sample preparation. A representative data table could look something like this, where you have your five replicates across the four different levels. The average value of those replicates followed by the accuracy and percent CV of those corresponding quality control standards. This is the proper way to do an accuracy and precision assessment per the ICH M10 guidelines. Now we get to one of the more interesting parameters, and this is parallelism. This is absolutely the most critical step that you need to do when doing a surrogate matrix testing. What parallelism is, is it's used to confirm that the surrogate matrix you're using is actually suitable for measuring the analyte, despite the calibration curve being done in a different matrix. So in the example that we talked about in if I am using aqueous humor as our biological matrix, but I create my calibration curve in plasma, parallelism would tell me if that is a suitable comparison to give accurate results of a compound. The requirements for this are very simple, very similar to the QCs, greater than four levels at those same Lloq low, three times the Lloq medium, 30 to 50%, and a high QC greater than 75% of the highest standard. Five replicates, again, two to three independent runs over several days are multiple analysts. The criteria, again, the exact same as the QCs, 85 to 115, a little wider, 80 to 120 for Lloq, and then 15% CV or 20% at that lower limit. In order to test parallelism, you do the exact same thing as the QCs, and except this time you're taking the test compound and spiking it with the biological matrix. So the actual matrix of your samples, you undergo the same sample preparation and you generate a data table that looks something like this, where again, you have the replicate values at each level, the average, the accuracies and the percent CVs. An additional step that we do here at EMRI Pharma to absolutely ensure parallelism is appropriate is a pooling biological matrix test. What exactly is this? So in the same concept as parallelism, it's used to ensure that the matrix that we're using, our surrogate matrix, is appropriate, and then the same requirements and criteria as before. Except the difference here is we're now looking at our internal standard response, our istd. The internal standard, if you remember, is added in our sample preparation and it's done at a known concentration. So any variations that we see in our internal standard would reflect any sort of matrix effects, whether it's enhancement or suppression. So how do we do this test? We take our test compound, but instead of spiking it in just our surrogate matrix or just our biological matrix, we actually spike it in a one to one ratio of each of these matrices prior to sample preparation. In doing so, we, we then are looking at not only our calculated concentration with the accuracy values, but we're actually now looking at our internal standard response of both the surrogate only versus the pooled one to one ratio. What this allows us to do again is to see if there's any sort of matrix enhancement or suppression as a result of the new surrogate matrix being introduced in the presence of the biological. In doing this and parallelism, you gain the confidence that you need that using this surrogate matrix is going to be appropriate for method validation. Anytime we do bioanalysis, we have to do a recovery assessment. What is recovery? So recovery is used to determine how efficient the extraction is of your analyte from the different matrix. It's used by actually comparing the analyte response in a biological matrix when it spiked before sample processing and then after sample processing. What do I mean by that? So imagine that same scenario where we have our surrogate matrix or our biological matrix. We add our test compound. We then do our sample preparation prior to analysis. We'll call that our pre spike. We're pre spiking the matrix before sample preparation. Post spike is when you actually spike the compound after sample preparation. So we take our blank matrix, perform the sample preparation and then spike afterward. By comparing the pre and the post, we're able to see how much recovery we should be getting based on what the ratio of response that we get in post versus pre, and that's represented here in the table with this percent recovery. What's interesting here is that the requirements of this need to be done at greater than three levels. So. So that's just the low, medium and high qc, not the lower limit of quantitation. Secondly, the criteria is actually much broader. There is not an exact criteria or percentage that you need to be recovering as long as you know what it is and as long as the recovery is consistent. Those are the guidelines that are given in the M10 document. As mentioned, anytime you do bioanalysis, you're uncertain of what the analyte concentration may be. As a result, you may need to dilute your sample to have the analyte concentration fall within that linear range. How do you know that the dilution that you do is appropriate? In order to determine that you actually do this a dilution integrity study where you apply the same procedure of the analyte, but you just dilute the sample and make sure that you have following criteria, 85 to 115% accuracy and 15% standard deviation over the mean as defined as percent CV5 replicates are required, and you must start with a concentration above the highest concentration in your standard curve in order to do the dilution. Here's a representative table of what that could look like. Where you have a stock at 100x, you do a 1 to 100 dilution followed by the sample preparation. Then you determine your accuracy and percent CV based on the instrument's calculated concentration. Last four things we want to talk about today are about stability. One of the most important criteria when dealing with bioanalysis. The first type of stability is actually freeze thaw. So by taking a sample that's frozen, thawing it, freezing it, thawing it, how stable is that? So in order to do that, we take our low and high QCs, freeze them for at least 12 hours, and you perform this cycling of freezing and thawing at least three times. The criteria then being 85 to 115% accuracy at a minimum of three cycles. So you take your test compound, spike it in the biological matrix, because again, this is what's actually going to be taken from patients and stored and frozen. You freeze it at minus 80, you thaw it for x cycles as long as it's greater than three, and undergo the sample preparation that we talked about. Ultimately, you end up with a data table looking similar to this, where you have your calculated concentrations at the low and high end, and then our accuracy hopefully falling within 85 to 115%. To demonstrate freeze thaw stability. The next important stability is bench top stability. So once your sample is actually thawed, how stable is it when it's on your lab bench undergoing sample preparation? So this is done to assess the impact of laboratory handling on your study samples. Again, we test our low and high QCs and we keep them on the bench for a reasonable amount of time. That at least simulates what the study samples will undergo. Again, 85 to 115% accuracy. So to do this, we spike our biological and our surrogate matrix with our test compound. We thaw it and leave it at room temp for X amount of hours, depending on your sample preparation. Following that, you generate a table very similar to the other one I previously have shown, where you have your calculated concentrations at the low and high end and the accuracy for both the biological and a surrogate matrix. The third type of stability is autosampler stability. How stable is our samples in the autosampler of our instrument? So here at Emery Pharma, we keep our autosamplers anywhere from 2 to 5 degrees Celsius. So we want to know how stable our samples are once they've been processed and are sitting in the auto sampler waiting to be injected. To do this, you perform this on all QCs. You keep them in the autosampler for a determined amount of time and you just repeatedly inject them throughout that time period. Your criteria being at 85 to 115% accuracy. Except for the LLOQ at 80 to 120, you would have a data table that really shows the accuracy over time at those four levels and that would indicate where you experiencing instability or in this case if you have stability throughout the entire duration of your auto sampler testing. Finally, the last type of stability testing that we do is long term stability testing, assessing the impact of long term storage in your actual matrix. So when a sample is collected from the patient, how stable is it when it's stored and frozen for how much time before we actually have to undergo the analysis? So we do this at low and high QCs and we remove them at designated time points, determining the accuracy at each of those time points. So to test this, we take our test compound, spike it in our biological matrix, freeze it at minus ADC and remove it at designated time points, ultimately generating a data table where you have your different time points of each level, the calculated concentration as well as the percent accuracy. In the final slide, I just want to conclude being the summary of all of the different parameters that we talked about today. I urge you and anyone who's listening to this to reach out and look at the ICH M10 guidance document. Otherwise, please feel free to contact Emery Pharma for any of your bioanalytical needs, any questions you have about method validation, or any questions you have about using a surrogate matrix. Thank you for your time and I hope you learned and enjoyed this presentation.
More from Dr.

Hippocrates said, let thy food be thy medicine #obesity #metabolicsyndrome #lustig #shorts #health



Bill Wilson, MD: Why GLP-1 Drugs Are Overpriced—and How Compounding and Competition Could Fix It

Nitrosamine in Pharmaceutical Products? A Deep Dive into Risk Management by Ron Najafi, Ph.D.

The Subcellular Processes That Belie All Chronic Disease. The Hateful (or Grateful) Eight #lustig

Bill Wilson, MD: GLPs May Reverse Carb Syndrome—Helping Patients Reach Zero and Sustain with Diet

Why Everything You Knew About Obesity Is Wrong | Dr. Robert Lustig on Sugar & Metabolic Syndrome

Robert Lustig, MD: How Fructose Fuels Fatty Liver, Oxidative Stress, and Metabolic Disease #fructose

Robert Lustig, MD: The 3 Types of Fat Fueling Insulin Resistance and Disease #insulin resistance

Bill Wilson, MD: GLPs May Reverse CARB Syndrome. Helping Patients Reach Zero and Sustain with Diet