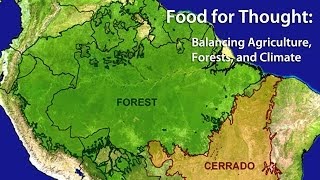
Food for Thought: Balancing Agriculture, Forests, and Climate
Lecture introduction for a Woods Hole Research Center talk by Dr. Michael Koh on human land use, Amazon field research, and connections between deforestation/agriculture and climate. The speaker's background (Woods Hole Research Center, prior affiliations, and upcoming Fulbright) is noted; the lecture is part of a series on environmental tipping points.
Welcome everyone.
Welcome.
Welcome to the Woods Hole Research Center. Good evening. I'm Skee Houghton. I'm the acting president here and I'm going to introduce tonight's speaker. This is tonight. Tonight concludes the three part lecture series on environmental tipping points. And the speaker for this one is Michael Koh. Dr. Michael Koh is a senior scientist at the Woods Hole Research Center. He's in charge or the leader of the Amazon program here. He is an Earth system scientist. That's someone who in this case looks at what people do with land, how people use land and what that does for energy and water budgets, what it does for the climate. That's what he'll be talking about. He leads a field research program in the Amazon and those field data he connects with remote sensing information, satellite data and computer models to do the things that he's going to talk about tonight. Before joining The center in 2005, Michael Koh was at the University of Wisconsin. He spent some time abroad. He spent time as a scientist at Max Planck Institute for Biogeochemistry in Jena, Germany and Lund University in Sweden. And next year he's going to be a Fulbright Scholar at the Federal University of Goias in Brazil. So without Further ado, Michael, Dr. Koh, thank you.
Thank you. So is this working well? Great. Okay, so again, thank you, Ski. So I'm going to talk about. My title is Food for Thought Balancing Agriculture, Forests and Climate. I'm going to wear glasses because I can't see my screen at all. Or alternative title is How Global Agricultural Demands May Be Pushing the Amazon Force to a Tipping Point. So I'm going to talk about work we do in the Amazon. And by we, I mean a very large team of people here throughout, in other locations in the US In Europe and in Brazil, in particular in Brazil who've been studying issues of what humans are doing to the Amazon forests. And just as a refresher, the idea of what is an environmental tipping point. Basically the idea that there's a limit to what the environment can absorb, what kind of human activities the environment can absorb. And in the first talk, ski talked about CO2 changes and how that affects climate and what tipping points might exist. Richard Williams talked about cryosphere, how changing temperatures may shift the Earth from one with a lot of ice to one with a little ice. And here I'm going to talk about the idea of deforestation and how that might alter the climate enough in the Amazon to make forests less viable there. So problem of course with tipping points are you don't really know where the limits are most of the time, you know that once you get to it, it can be a quick switch, but you don't really know where it is. So a small change can have a big impact. One little push at the end can put you over the edge. And of course, once you have change, it may be irreversible. So those are the kinds of changes we like to try to think about and avoid. So how does this pertain to the Amazon? So our fact, you know, the Amazon rainforests are generally stable. It's a big area of forest with varying climate throughout the basin, stable environment. But deforestation is definitely changing regional climate, changing climate in some regions where deforestation is occurring. So the question is, is there a point at which that new climate which we are creating will not support rainforest in that region? So visually that would be do we shift rainforest to something more like a savanna? And how does that work? Just as an introduction, this is the Amazon Basin. Basically water comes in off the Atlantic Ocean, it rains, it evaporates and recycles, it rains again, it rains again, it moves across the basin and out of the basin. It's used many times. It's a coupled system. That upward motion that's creating rainfall also drives the inward motion from the Atlantic Ocean which brings the rainfall. So it's this coupled system between change, one part of it and the whole part cascades and changes. So the idea is that if you deforest enough, then you decrease the rainfall, you decrease the inflow, which decreases the rainfall more and you get a new system with less rainfall. That's what we want to explore the idea of. So the outline of this talk then is I'm going to just introduce the basin, talk about what the Amazon basin is, talk about the deforestation and degradation that is occurring there. Now move to how those affect climate and hydrology regionally and talk about how we're measuring those changes and what we learn from what we measure in the field. And then address this issue of are we approaching a tipping point? Use numerical models, computer models to address are we approaching some point at which we are changing the environment significantly? So Introduction so this is the Amazon Basin, six and a half million square kilometers, roughly middle of Central America, composed of forests in green, water in blue, a lot of croplands and pasture in yellow. Large, large environment and how large this is the United States superimposed on top, just to give you a scale of so it's the world's largest watershed by far. This is an image of the river about 800 miles from the Ocean. This is actually a tributary where it meets the river. Several miles across, 200ft deep. So it's a very large river. You can look at this list. This is a list of the top 10 rivers of the world by discharge, by the amount of water that flows through them. The Amazon's the top. It's five times larger than number two. And in fact, if you added up all nine of the other ones, you'd get the same as the Amazon. So it's a really big river. It's basically 20% of the entire discharge of the planet is that one river. So that's the river itself. Oh, and you know, nice pictures of it. This is the river in the wet season. It's a very large river, big floodplain. Lots of people live on the floodplain, on these levees and, and raise cattle and crops there. That's a picture during the vacation season actually. Just, it's a very big river, has lots of uses for the people there. And this is what we're calling an undeveloped view of the Amazon. I struggle with what to call that. But basically this is a reconstruction of what the simplest vegetation would look like in the Amazon basin if humans weren't disturbing it. Green is forest, evergreen forest, beige is savanna, like grasslands and mixed trees. So basically two big types of vegetation exist in this basin if humans aren't disturbing it. And it follows this gradient from the northwest, lots of rainfall, southeast, a lot less rainfall, maybe 3 meters in the northwest or more meter and a half in the southeast with a lot of, with a very long dry season. So you get this grade from forest to savannah, what it looked like. That's just an aerial view of tropical rainforest in the Amazon. Interior shot, dense canopy, many levels of vegetative growth. And another interior shot just, you know, show what it looks like. Savannah in the beige, smaller portion of the basin. So that's an aerial shot of savannah, individual trees separated from one another by a certain distance based on how much rainfall is available. Basically I always say it looks like a chenille bedspread. It's just these very, very nicely spaced trees. And that's one type of savannah. Ground shot of it. And again, within it, deciduous trees tends to be dominated by drought. Deciduous trees during the dry season they lose their leaves, whereas the rainforest doesn't lose its leaves through the dry season. So deforestation and degradation. What is happening there? This is again, this is a satellite image, satellite derived image of the percent of forest in the Amazon. So green is forest, beige is less. So the orange line. We've drawn is sort of that line between where the savanna is and the forest should be. So you see anything this side of the orange line really should be forest, but it's not. In many of these areas, that's where the deforestation has taken place. So there's a significant portion of this part of the basin here that's been deforested as of 2010, I think, is this image. How much? Something like a million square kilometers of the basin. If we consider the full watershed that sets something like the area of California and Texas together for scale. What's it used for? 80% of it's for cattle, roughly speaking, 20% for croplands. And the crops are basically soy. It's the major crop. Those are the major uses of the land once it's deforested. Cattle and soy cattle. There's what cattle look like in the Amazon. That is a pasture in the dry season in what was rainforest. So imagine that was forest, and now it's not. They've saved one tree. I think that was awfully nice of them. Yeah. So beef, what's driving this? Brazil has the largest commercial cattle herd on the planet. It has 200 million head of cattle. That's the number two global exporter of beef. For comparison, the US has 100 head of cattle, 100 million head of cattle. So basically, Brazil has twice the herd size. Also on a lot more land, the herd density is something like one head of cattle per hectare of land, or two and a half acres of land. So it's very dispersed. And a third of that is in the Amazon basin. A third of that cattle, soybean, the other big product. This is the soybean field in central Brazil during the wet season. During the growing season. This is the same field in the dry season before planting. So those are all tractors in the background plowing the field, preparing for soy. Brazil is now the world's largest producer and exporter of soy, past the United States in the last few years. And the primary use of soy, we should keep in mind, is for animal feed. So it's being exported around the planet to feed animals. And what's driving it. You can see this graph shows the areas of the world that are importing soybeans from 1990 to 2012 and then projecting beyond. And the thing to look at is this purple is China. It went from zero in 1994 to almost 2/3 of the entire plants. Imports are going to China in 2012, and the projections are for that to increase. So there's enormous demand for soybean as Countries become more wealthy to feed cattle, to feed people, and Brazil has responded to that very rapidly. This is just an image of. So when you talk about deforestation, this is how they do it. They basically mow down the trees. These are trees that have been then pulled down and then put into rows. They put them into rows and they burn them repeatedly until they've opened the land up to plant as soybean. You can see they burn it black. And this is trees where fire has escaped into the forest. And this is a movie of deforestation in action. So this is something we took from a truck when we were down there once. What's happening is they've got a chain, you can see it, attached to two tractors, and they drag along and basically mow the forest. It's very effective as a means of clearing large amounts of land. This is illegal deforestation occurring on someone's farm. And they're going to convert it, I'm fairly sure, to soybeans in this case. So there's the chain, just nice big chain links attached to two bulldozer, like tractors, which I don't show because I don't think they really like us taking a movie of them doing that. So I was kind of trying to be sneaky. So that's deforestation. Another source of degradation of forests is fire. It's a big one. And this is just an image of ignition sources in red. And what I want you to take away from that is where there are humans, there is fire, is basically what that shows. Fire is a tool that's used to open up the landscape, to get pastures, to reinvigorate pastures, or to open up land for hunting. So it's commonly used, traditionally used as a management tool. Basically, you burn a pasture. The problem with that is it often escapes into neighboring forest. And this is a typical forest fire in the Amazon. And it doesn't look like much. The flames are maybe this tall. It's nothing like what we're seeing in Australia now or we see in the western United States. But it's extremely effective at killing trees. Trees aren't adapted to fire, so it's extremely repeated. Small fires like this are very good at killing trees. So it's a good way to degrade the forest or an effective way to degrade the forest. So the third part of this, then is how are these things, this deforestation and degradation that humans are doing there, affecting hydrology and climate? And I show this image because you just look at this. This forest behaves very differently than this soybean field. They visually look very different and they behave very differently. Sunlight and rainfall come in here and hit these two landscapes, and they do very different things. And that's what we really want to find out. When I say different, what happens? If you look at this is my little cartoon of the water cycle. Water comes in from somewhere upstream, upwind. A portion of that goes downwind, but a portion of it rains on the landscape. That rain goes into the soil column and becomes soil moisture and it is tapped by vegetation and sent back to the atmosphere. A good portion of it is two thirds or more. Usually what isn't runs off into the streams. That's just your little cartoon of the water cycle. You cut down the trees, what happens? And you replace it with croplands or something. Basically, the evaporation goes down because whatever you replaced it with uses less water. In the forest, it has a shorter growing season. If it's soybeans or pasture, it's only growing for a few months. It has much shallower roots. So the result is it uses a lot less water. So less goes to the atmosphere, more goes out, more stays in the soil column and then flushes out to the river. And, you know, so more water in the river seems like a good thing, but it's really not. What you're doing is short circuiting this entire cycle. That water that went back to the atmosphere used to go back to the atmosphere was used for something else somewhere else. It was rain back out somewhere else. So now, instead of doing that, you're sending it out to the rivers and to the ocean. So it's a short circuit visually. This is a forest, this is water. Basically, so much water comes out of the forest in any day that it condenses and forms clouds over the forest. It is an enormous amount of water coming out of the soil. This is rainforest that was deforested and turned to cattle, pasture and soy. That is a dust devil. And what's illustrating is it should look like the previous picture with a forest and clouds. Instead, it looks like this. It's extremely dry. There's a lot of soil moisture here. It's trapped underground, but there's nothing putting roots down to pull the water out. So what happens is instead, the sunlight that comes in heats up the surface like a frying pan. And all that heat has to leave the surface in the form of things like dust devils. It's a completely different energy and water cycle. Instead of supporting vegetation, it's now heating up and evacuating, basically via dynamic forms like this. That is the basic problem. There's where putting more water in the rivers becomes a problem because this is a incredibly different environment for whatever wants to live there. So we've been trying to measure those things, or we have been measuring those things for quite a few years now and trying to understand the scale of the changes that humans are causing and how you try to reduce those. We've been doing that at a ranch called Kanguru. It's this little red triangle there, right on the edge of the savanna and forest regions. Zooming in a bit, this is the branch again, the red triangle. It's embedded in this watershed, the Jingu watershed, which is about the size of New York and Massachusetts combined. That watershed I've outlined there. This is the ranch. Green is forest, beige are deforested regions. So these are all places with crops and pasture. This is a very large indigenous park Downstream of of it's a protected forest and indigenous land downstream of all these farmlands. This ranch location is a very good location to study this interaction between humans and the environment. Zooming further to the ranch. So this is the branch we work on. It's 200,000 acres. It's mixed forest and soy. So this is original forest that was never cut down. These are soybean fields. They were originally cut down in the early 80s. Cattle was converted to soy in the 2000s, and now they're raising soybeans, followed by corn in one, double cropping in a year. That's kind of the classic trajectory that's been occurring in this region. Cattle to soy to double for scale. That's the ranch on Cape Cod. So you see, 200,000 acres is a significant chunk of land about 40 miles tip to tip. We work there. There's a crew full time there that collects data and fixes things for us. There are nice accommodations that are quite pleasant in their own way. Share the accommodations with all kinds of different denizens. It's a great place to work. And our objectives there are to measure the basic components of the climate system. The temperature, the evaporation, the soil moisture and the stream flow. And we do it with satellites and with field observations. We use satellite observations from above and we use field observations on the ground to try to get a good picture of the environment there. We try to get that for each of these environments, the forest and the soy, so we can compare the two and see how they differ. It's a giant paired experiment. Just as background, this is what rainfall looks like at this location. The total, about 1700 millimeters a year of rainfall. So that's about this much, you know, somewhere about this much. But it all falls in a very short period of time. Well during half the year, but most of it in a three or four month period centered on January. So intense rainfall in a short period of time and then a long dry season, well, five or so months. So first I want to show some of the satellite analysis. So here's the ranch and we use satellites. Basically they're great because they're going overhead all the time and they're taking measurements at set intervals where basically in this case we're using MODIS data. Each of these boxes that we've drawn on there is one view from satellite and each is about 1 km on the side. So what's nice is we can break the landscape up into green boxes where there's forest and paint boxes that are croplands and we can take distinct measurements from each and compare them. So we're able to see very closely what's happening on the forest and what's happening on the cropland. What is happening? It's a lot hotter over the top. This is temperature 34 degrees C versus 29 over the forest. Surface temperature is much hotter. 5 degrees C, so 9 degrees Celsius, hotter annual average season. Also a lot less water here we can measure 30% less evaporation from the crop. All that rain that comes in, there's 30% less of it going back to the atmosphere. Where's it going? It's going to the soil. I'm going to prove that too. I'm going to show that. So I'm standing at the bottom of a pit here, 30ft deep and I'm looking straight up at the sky just to get your bearings. It's a nice 1 meter by half meter pit looking straight up. And we've instrumented it just to measure soil moisture through going down 30ft. And this is, that's Darlison. He's one of the workers at the ranch and he's sitting at the top of the pit. He's sitting on the edge of the pit and he's downloading the data. One of his many jobs to collect data for. In the background are rheas, a big big bird like an ostrich, which are in fact native to this region. They're native to the savannah since they've deforested example of some of the changes that occur. So soil moisture. There's 15% more soil moisture in the cropland area than there is in the forest. It's very clear. A lot more moisture in the soybean field than There is in the forest. We can measure that. And why? Well, soy is using less water. It only grows for three months, and then fields pretty much fallow. There's nothing there to pull moisture out of the soil, whereas the forest is using it throughout the year, including the dry season. So we can measure it another way. And I like this way because we've got a cable. Basically, we can shoot electricity in the ground and measure how much soil moisture there is in the ground. Over a long transect, we can from the soybeans into the forest. And visually we can then visualize what the moisture in the soil is. And this is going down 15 meters, so 45ft. And it's 300 meters long, three football fields long. Soybeans on the left, forest on the right. Blue means wet, green means less wet. So a lot more water under the soybeans in the wet season than there is in the forest. And that carries through to the dry season, a lot more blue. And it's trapped because there's really nothing on the surface to pull it out. So it's running down through the soil column now, whereas in the forest, the forest is pulling it back out, putting it in the atmosphere. And where does it go from there? Well, it goes into the streams. We've been measuring stream discharge there since 2006 in the forests and in the soybean fields. And what we see is there's four times more water in the soy streams than there is in the forest streams. So the forest streams have very little water in them. Soy streams have four times as much. So we've been able to see then very clearly what happens when you deforest Rain still falls, but it goes out to the stream instead of going back to the atmosphere. And so the important point here is that's what we learned at the ranch. And the important point to remember is this isn't limited to one ranch. This is that Jingu river basin. This is New York State and Massachusetts combined. Red is the surface temperature. Again, there's the surface temperature. Red is hot. Blue is less hot. So that indigenous reserve is cool with forest, and all this region around is really hot. That adds up to a big environmental change when you start talking about that size. Plus, you look over here and over there beyond the xingu, it's all like that. And that's also the same for the water. This is the evaporation viewed from satellite. Blue, a lot of evaporation over the indigenous part. Green a lot less over the farmlands. You start thinking about how much water that is that's not going back to the atmosphere. You could, you can estimate there's probably 10 to 15% more river discharge in that big river going through the middle of the screen there. We don't know that because we have absolutely no measurements there. But if I just add up what's not going back, that's about what it would be. So that's a really interesting question to us. Is that occurring on a very large scale? We couldn't do that there, but we can, we're able to show that somewhere else. The ranch we're working on top there, due south is the Araguaia River. There's a discharge station at Arawana that's been measuring discharge since 1968. They've got long river. During that period it went from totally forested to more than 50% deforested. Pink here is. It's deforested. So we have a record of this basin going from pristine sort of to really deforested. We have the discharge occurred then. What did it look like? Well, in the 1970s, this much discharge. In the 1990s, there's 25% more discharge in that river. This is a big river. And there really wasn't any change in rainfall. Very small increase in rainfall. So we think about, there's one equation. Discharge is equal to rainfall minus evaporation. On the long time scale, our discharge went up by 25%. Our rainfall really didn't go up by much. So that means the evaporation had to have decreased. And the question is why? Is it because of the deforestation that occurred? Is it because of climate variations or some accommodation? That's really what has to have occurred there. One combination of these things had to have occurred. To get at that, we. This is the second part of what we'd like to do. We start at the field scale and we look at field data. Next thing we like to do is we use computer models. We build computer models and we apply them to these regions. And computer models, I mean, basically what you're doing is you're just breaking the landscape up into boxes and you're putting in each box the characteristics of it. The vegetation, the climate, the soil, the topography, all the things that make up that area. But the great thing about a model is you can just mix them up as you like to get different scenarios. So in this case, what we can do is we can simulate this river basin, the Araguaia, with and without land cover changes. So we can say, I'll start in 1970 and I'll just leave the land alone. And I'll see what happens. And what does happen is we get the observed discharge with 25% greater. We get about something less than 10%. If we do that, if we don't allow land cover to change, if we keep the forest there, we get a small change in discharge. If we deforest it like a curd, we get basically a 25% increase in discharge. So the model allows us to say very clearly that what we observed is a function of human actions. Deforestation, in this case, 2/3 of it. Getting back to that, humans have made a big difference at a big scale. In this case, two thirds of what we observe is from deforestation. The other third is from that rainfall change that did occur. So the last question, or the part I had up there was, you know, are we approaching a tipping point? But we know that we can change the climate a lot. We know we have changed a lot in some locations. So are we reaching a tipping point? Is what we've done so far or what we do in the future big enough to make it shift the system? We have a colleague in Brazil who create simulations of what deforestation might look like in the future in the Amazon, based on people's actions, governance, how well deforestation is being controlled, where roads are being built. All these different factors go into coming up with scenarios of what deforestation might look like in the future. In this case, the future being 20, 50, 40 years from now, going back, this is the basin today. Forest and green yellow agriculture. I was saying it's about 17% of it is deforested. It's got a scenario of good governance in the future where laws are being followed. In that case, about 35% of the basin is deforested. He's got another scenario with poor governance where it's just let people deforest at the rate they had been in the early 2000s and see what happens. And there you get about 50 to 60% deforested. And he calls these scenarios for good reason. These are just trajectories that it could go in the future, but who knows where it will actually go? And it all depends on what people do. But they're plausible. But what happens when you do that? We get back to that schematic of the water cycle. At some point, if you you forest enough, you're going to start shutting this system down. You've got less water going back. You're changing what the surface looks like. Rainfall decreases, that feeds back to what pulls in from the ocean, that decreases soil moisture, decreases your river flow decreases the Whole system starts to shut down to some point because of these imposed land cover changes. We and numerous other groups have run many simulations with global climate models to ask, okay, if we deforest like these scenarios, what does happen? Is there a tipping point? And the answer in the models is yes, you can push the system too far and you get something that's unlike what we have now in regions of the Amazon. And what does it look like? Well, it's an ecosystem with a lot less rainfall. 10 to 15% less doesn't seem like a lot, but it has big implications. It causes things like increased drought, longer dry season, more severe drought, more frequent drought. When you do this, it would also be an ecosystem with greater fire. We've shown very clearly that forest fires are much stronger and more common during drought years. So you increase drought, you increase the fire, that increases forest degradation. So you get lower biodiversity. You basically get a forest, an impoverished forest with fewer species and less overall biomass. You also get decreased crop productivity. We've shown that under a scenario where you get 10 or 15% reduced rainfall, you get about a third 30% reduction in soy productivity. So the amount of soy you get off the land drops by 30% in a good portion of that area that's deforested. And in some cases that's basically made the crop no longer economically viable for the region that was deforested for that purpose. So it's basically a lose lose situation. We also shown that you can probably get a pretty big decrease in hydropower. Big. This river that we work on, the Jingu, they're building the world's third largest hydropower dam. And with a 10% reduction in rainfall, that translates to a 40% reduction in power from this dam. So it's a significant change to the environment that can occur. The bottom line is when we ask, are we approaching a tipping point? Well, maybe. We certainly can get to a tipping point with a certain amount of deforestation. But there is good news, and that is this is just an image showing deforestation rate in red square kilometers per year from 1988 to 2012. What we see is it peaked in 2005 and really dropped off. So deforestation has gone down from something like 25,000 square kilometers a year. That's two to Massachusetts in the 2005 to less than 5,000 in 2012. So there's clearly a change in deforestation. So can we avoid a tipping point? Ten years ago, I would have said we were heading straight for tipping point because deforestation rates were so high. But there is good News. And that is this is just an image showing deforestation rate in red square kilometers per year from 1988 to 2012. What we see is it peaked in 2005 and really dropped off. So deforestation has gone down from something like 25,000 square kilometers a year, that's to Massachusetts in 2005 to less than 5,000 in 2012. So clearly a change in deforestation. So can we avoid a tipping point? Ten years ago, I would have said we were heading straight for a tipping point because deforestation rates were so high. Now I would say, yeah, it can be avoided. We can see that deforestation has already decreased. That's because of several factors, things like market incentives. The European soy market doesn't want to buy soy from lands that were recently defor. So they put a moratorium on any imports of soy from recently deforested lands. That causes a reaction in the market. Monitoring enforcement has gotten a lot better in many of the places in Monte Grosso and Brazil. So illegal activities are easier to find and find people for them. Protected areas have increased. There's 50% of the Amazon basin is now in protected areas. So there's a lot of reasons why deforestation has already decreased. And there's also great opportunities in the future for lower impact production. In other words, for getting more agricultural production out of the same amount of land that's deforested. That's a big push is to avoid new deforestation for increased production. Those are things like voluntary markets. There are quite a few peer organizations where the farmers are members of the organization and they follow. They basically follow certain stewardship, environmental stewardship rules in order to get a green stamp, in order hopefully to get a better price for their product in the market. These are voluntary organizations rather than being federally driven fire management. There are opportunities there. There certainly are state and even vice voluntary organizations whose job is now to monitor where fires occur and try to put them out, which is something new, really. There are policy and fiscal incentives. Basically, a soy farmer, a loan to a farmer can be tied to following environmental laws. These are new, relatively new, and relatively effective. There's also a huge pool of underutilized land. There's probably something like 185 million acres of land that could be converted to some form of agriculture that's already deforested, that could be converted to more productive agriculture. So there's a pool of land already deforested there that could take the pressure off deforesting new lands. Again, I come back to, you know, can we avoid a tipping point? I would you know, tipping. Ten years ago, I would have said no. Now I say, yeah, we can avoid a tipping point if these kinds of actions are followed very carefully. So that gets my conclusions, and they're simple. These are the take home messages. Deforestation has transformed a portion of the basin already. The climate and hydrology, clearly we've shown that, and you can see it, and it's big. Continued deforestation, rapid deforestation, could lead to a tipping point that is also a clear outcome. But there are many opportunities to avoid reaching that tipping point. And our job here is to continue to do science so that we can help people avoid doing that. So with that, thank you.
More from Tod


WHRC's Sustainable Science Speaker Series - Dr. Toby McGrath speaks on Sustainable Fisheries