Going with the Flow
Max Holmes explains why rivers are key to understanding how land and water systems exchange carbon and nutrients globally. He presents data from the Amazon, Congo, and Arctic showing that soils and permafrost hold about 3,000 petagrams of carbon, with 1,500 in the Arctic alone. Holmes describes using satellites and river observatories to track these changes and inform climate policy.
Chapters
We're especially privileged today, as Shelly mentioned, to have with us all day on the campus today a very unique organization, the Woods Hole Research Center. We know that you are aware that they're one of the world's preeminent research organizations. They do some amazing work all over the world and their work really makes a difference. In fact, if you get on their website and you read their mission statement, it sounds exactly like a quote from Jack Dangerman, our founder. They're making the world and society a better place to live through science and applying science and their best efforts toward improving some of the problems that our Earth and our environment faces. So we're delighted to have them back. They were actually here about two years ago and we're very, very pleased to have them here again tonight. If you get on their website, by the way, before I forget, there's an opportunity on their homepage to make a secure online donation to the good work that they do. So I'd like to encourage everyone to check that site out. If you have an opportunity, make a donation. They're doing incredible work, as you're going to see tonight from our special speaker in just a moment, Dr. Max Holmes. Our guest speaker tonight is an amazing individual. He holds a position of a senior research scientist at the Research center and he's also a guest investigator with their sister organization, the Woods Hole Oceanographic Institute. He's been with them since 2005, and prior to that he served as a staff scientist on the Marine Biological Laboratory. Some of Max's research work has included global river biogeochemistry, land to ocean, global carbon flux, and the Arctic hydrologic cycle. Max received his BS Degree from the University of Texas, a master's degree from the University of Michigan, and his PhD from Arizona State University. He's also the author of numerous publications and he's done a lot of work with the National Science Foundation. And I had the good opportunity to get together with him this afternoon and chat and see some of his work. It's truly amazing. You'll see some of it outside in the lobby. So we're really, really delighted and honored to have him address us tonight. So please join me in welcoming Dr. Max Holmes.
Well, first, thank you all for coming. This is a real honor to be here. I'd like to thank ESRI and University of Redlands for putting on this forum and all of you for coming out. It's really amazing to see what 300 people on. I don't even know what day it is, but come out on whatever day it is to Hear some guy from Woods Hole talk about something, and that's what I'm going to do. So, as Laurie said, I'm from the Woods Hole Research center. That's in Woods Hole, Massachusetts, a little village on Cape Cod, just about as far as you can be from here and still be in the United States. The Woods Hole Research center, we're a relatively small organization, about 60 people, but we work all over the world mainly on terrestrial systems and linkages of terrestrial systems to aquatic systems. And I'm going to talk about some of that today. I'll talk about my passion, which is rivers, but I'll also bring in work that other scientists at the Woods Hole Research center are doing on land around the world. Lots of people have contributed to this talk, have contributed to the science. I want to highlight just a couple of people right at the start who have been a really big help in putting together this presentation. Greg Fisk, who's sitting here in the front row, he's the GIS manager at the Woods Hole Research Center, Geographic Information Systems Manager. And if there's anybody in this auditorium that doesn't know what that means, you're kind of in the Mecca of GIs right here. It's a real honor to be here. The other person is, and Greg produced the maps that you'll see and also did the sort of geospatial analysis associated with those maps at the gis. The other person is Chris Linder. I've worked with Chris for a number of years. He's a photographer and he's gone with me on several expeditions to Siberia, to Africa, to South America. And I'll show a bunch of his photos today and also a couple short videos that he produced. So thanks to those two guys, each of the photos that I'll show, I'll have some geospatial information on them. The coordinates, the watershed, which I view as equally important, and just the name of the site. So when I was thinking about this presentation, I took a look at the ESRI website, and this was on the top of, I think, every one of their web pages. And it really grabbed me the statement, understanding our world, that's what motivates me as a scientist. I think that's what motivates lots of scientists. And it's really remarkable to see a company that has that same passion, that same mission. And it got me thinking. This is really an incredible time to be a scientist. There's all this vast knowledge that's been accumulated over decades and centuries, and we have all that to fall back on There are right now incredibly important questions that we can ask that we don't know the answer to. There's 7 billion people on Earth right now. We're headed to 8 or 9 or 10 or who knows what. The Earth is changing rapidly in all different ways. How's that all going to play out? We don't know. That's what we're working on. Importantly, there are all kinds of incredibly sophisticated tools that we now have at our disposal. The presentation that I'll give today, lots of the data came from satellites that are whizzing around space, collecting information all the time from images that they're taking. There's computer software like this stuff that Esri produces, ArcGIS, that helps us analyze these vast data sets and even help shape the kind of questions that we can answer. I think 20 years ago, some of these questions you couldn't even imagine that we can now address right now with these tools. And the final thing I have on here is not necessarily a good thing, but from the standpoint of understanding how the Earth works, one thing that scientists like to do is do experiments. And of course, nobody would do an experiment on the whole Earth, except that's what we're all doing. So I hope you've all left your cars idling in the parking lot. But, yeah, no, this is not a good thing. But it's a unique opportunity to understand how the Earth works. We're warming the Earth by putting greenhouse gases in the atmosphere. That's changing all different dimensions of how the Earth fits together. And we can learn from that. At the Woods Hole Research Center. I said we're about 60 people. We spread out around the world. It started the founder sitting in the audience, George Woodwell, at his start, we focused on the forests of the world, and we're kind of branching out from there, but it's basically focused on land, how it's changing its role in the global carbon cycle. I'll talk a lot about rivers. The title of my talk said rivers. But I'll also talk about watersheds. And I want to make sure that right from the start, everyone knows what I mean when I say watershed. So what's a watershed? What river is this? Yeah, Mississippi, the biggest one in the United States. So this shows this branching network that is the Mississippi river system. And here's the watershed of the Mississippi River. So the watershed is the land area which drains into a particular river system. So if you imagine rain or snow falling in this yellow shaded area, that will eventually end up in the river network and pour into the Gulf of Mexico, if it's not evaporated beforehand. What watershed are we in now? Santa Ana. Yeah, it took me a while to figure that one out. But here we are. Wherever you are, figure out what watershed you're in. That's the most important thing. So here we are. This is actually, I think it's at least one of the largest watersheds in Southern California. Important. Here we are. Wherever you go, you're standing in a watershed. This is some of the earth's biggest watersheds. It gets a little dicey in places like the Sahara Desert, but basically anywhere you are, you're in a watershed. Now a bit about rivers. I have a six year old son, two year old daughter. About two years ago my son started asking me the question, dad, why do you love rivers so much? And first of all, it's true, I do love rivers a lot. And it was, I understood where the question was coming from because I'm always talking about rivers, I'm always traveling around the world to work on rivers. And I don't know that I had a really good reason or a good satisfying explanation because he keeps asking that question and now his two year old sister asked the same question. But this is my answer to them. So I'm going to try it out on you guys today. So some of these reasons are scientific reasons, some of them are personal reasons, some of them are blends. The first one for me is a personal. Rivers flow, they're dynamic, they change. How could you not like working on rivers? You can sit beside a river and watch it go by and watch it change. You can sit on a river and drift down and watch the world go by. There are scientists that spend their career working on flow of rivers. That's not me. This is just a reason I appreciate rivers. River shape. This is probably the quintessential example of that. Rivers shape the face of the earth. The Grand Canyon, of course, but anywhere, look flying in a couple of days ago, coming over the mountains or over the desert. You look down and you're looking at something that was shaped by flowing water. Again, some scientists spend their careers working on this aspect of rivers. I just appreciate rivers more because of it. This is more to the core of my science. Rivers integrate. That is the chemistry and discharge of a river at any given point is a function of processes occurring in its watershed upstream. So this is the confluence of the Amazon river and the Tapajos River. This is a photo that we took just last month. The really milky water. That's the Amazon. That's coming from The Andes. So there's lots of sediment in there. The tapajos is coming out of the rainforest. You can just visually see this is very different. It's not due to local processes, it's doing to. It's a function of their watersheds. Different land cover, different topography, different things like that. This is another photo from just last month when we were in Venezuela. And this is what really gets me excited, looking at rivers that look like this. So there's almost no sediment in it, but that color is dissolved organic carbon. It's essentially like tea. This is not material that was produced in the river, but it's leached in from the watershed, from vegetation, from soils. And we can analyze the chemistry and learn about what's going on in the watershed. Rivers link, they link the upstream parts of the watershed with the downstream parts of the watershed. They link the land to the ocean. And this is one of my favorite shots of planet Earth. This is a satellite image of the Lena river delta in Siberia. It's false color. So this is not actually the color of it, but you can just see this really intricate branching pattern. I've showed this to people and asked them what it is. And you can't figure out the scale unless you're told this is hundreds of kilometers across and it looks like coral. You get all different kinds of answers. But just a beautiful shot of the Earth and what it I should say the lane of rivers flowing from south to north, dumping into the Arctic Ocean here. And the sediment in the river settles out and builds up this delta. This is what probably got me into rivers in the first place. As a kid growing up in northern Michigan, I would spend any spare moment I had fishing. And I still pretty much spend any spare moment I have fishing. So rivers, they're biologically active, that can be useful for recreation. It also sustains millions of people around the Earth. This is a shot from was the Arctic grayling in a river in northern Siberia. I want to show now, it's about a five or six minute video about some of the work we're doing in the Congo. And it kind of elaborates upon some of the points I've made here, particularly the connection between the chemistry of rivers and the watersheds of rivers, the land cover and change. So I'll start this and take a break.
Congo river for us is a blessing of God. This river give development, transportation. We take the fish to eat, take.
The water to drink.
Our life is always. The Congo represents the world's second largest watershed.
The most pristine tropical rainforest left in the World current estimates about 1% deforested.
So it's a much more pristine system.
Than the Amazon, the Orinoco and most.
Of the tropical rivers.
And so we've got a unique opportunity right now to examine what's going on.
Then, to see how this changes into the future.
Just like when a person goes to a doctor to get a physical and the doctor takes a blood sample and analyzes the blood to learn something about the health of the person. We do a really similar thing on rivers for collecting water and measuring the chemical composition of that water. And that can tell us something about the health of the Congo river and its tributaries. So we're interested in different watershed types, savanna or grassland, rainforest or swamp forest. We've also sampled tributaries that have differing degrees of disturbance, like logging. And we're interested in how deforestation influences the chemistry of the rivers and what the chemistry of the rivers then can also tell us about what may be happening in the watershed.
Trying to take a good, clean, scientific sample here can be a challenge. We've had to sample sites where we've had military presence, usually armed, in fact, always armed. Every evening we set up a mosquito net over the bed. These mosquitoes carry a whole host of tropical diseases. To access a lot of these rivers, we've had to go in small boats down very, very small rivers, where as you sit in your wooden pirogue, which is about as wide as you. The river is about as wide as the pirogue, you have branches smacking you in the face, the bottom of the pirogues leak. Again, it's a challenging environment. So we're interested in actually what's in the water, the particulate phase, bits that you can see, if you like. We're also interested in the dissolve phase, so the things you can't see, but often impart colour to the water. To separate out the water, we filter it through different types of membranes that we have with us. This is very similar to when you make coffee at home. You'd use a coffee filter and it keeps the coffee grains from the actual coffee itself. So you could say the coffee grains are like the particulates, the sediments that we have, and the coffee itself is the liquids that have the dissolved phase in them.
Probably a thousand times during this trip, we jokingly said what could possibly go wrong, because anywhere you look there are potential roadblocks. But we got all the samples we wanted and anybody in the world, if they looked at the samples, could see that these came from very different sorts of rivers. Some of them are crystal, just like the water you might get in a bottled water or in your bathtub and other looks like the darkest tea you've ever seen. And what we're looking at are different dissolved organic carbon concentrations and forms of dissolved organic carbon. So it's really exciting just to see the contrast. We know so little about this region.
Really, due to political factors, instability in the region, problems with logistics. The Congo has been historically under sampled. The work we're trying to do now and moving forward into the future is.
In many cases the first time these sort of studies have taken place in this region.
So really it's opening up a new frontier for science within Central Africa and.
Fundamentally improving our knowledge of this region and hopefully the way these sorts of systems work and their relevance to the wider world. So now I'm going to shift gears a little bit and talk about global climate change. This is obviously a very big topic. I'm not going to go into all the nitty gritty, but I'm going to ask one what I think is an important question, and that is what and where are the largest vulnerable carbon pools? What I mean by that is where are the pools of carbon on Earth that are now on Earth that could potentially end up in the atmosphere? The vulnerable part is that, you know, could go from where they are now up into the atmosphere as greenhouse gases. From the standpoint of global climate change, I'm not particularly interested in the large pools that aren't vulnerable or the vulnerable pools that aren't large. So I want to try to ask the question, where are the large and vulnerable pools? This is, I think, how many of you have seen this figure? This is kind of the key figure with respect to global climate change. I think it's called the Keeling Curve, named after the scientist Charles Keeling, who's from the Scripps Institute of Oceanography in San Diego, La Jolla. And what he did is in the late 1950s, he started measuring the carbon dioxide concentration of the atmosphere at the top of Mauna Loa in Hawaii. And what he found after doing this for, well, a couple years, it goes down, up and down. Each year you learn some interesting things about how the Earth functions just based on that, up and down. But as you accumulate a few more years of data, you start to say, hmm, it looks like it's going up. And it has continued to do that into the very present. These data go up until just a few weeks ago. You can get this essentially real time data here. It's expressed as the concentration of carbon dioxide in the atmosphere. I Put another axis on this graph which expresses it as a mass, pedagrams of carbon. Because it's going to allow us to more easily compare the amount of carbon in the atmosphere to the amount in the pools on land. A pedigram is a hard thing to wrap your head around. It's a really big number, It's a really big mass. One pettigram is 1 billion tons. And I'm sure you can all picture what 1 billion tons is. But if you can't, here's a metric. This is some work done at the Woods Hole Research center, looking at the biomass in vegetation, largely in forests in the United States. This map actually here shows the carbon content of that. Or you can use the biomass to calculate the carbon content. And in the conterminous United States, if you think of all the vegetation in the United states, there's about 13 petagrams of carbon in that. That's sort of a benchmark for you. Since this record began in the late 1950s, the increase in the atmosphere has been about 150 petagrams. And as you all probably know, the concentration of greenhouse gases, carbon dioxide, in the atmosphere is linked to warming. That's why we're worried about this. As this keeps going up, the Earth keeps warming, other things happen as well. And a big question is, where does this go moving forward? Does it keep going up? Does it level off? And one way to think about the answer to that question is again, what are, where are the large vulnerable pools? What might be happening with them? So can anyone think of a large vulnerable pool of carbon? Amazon rainforest. Yeah. So forest. That's a good one. Another one lands beneath the permafrost. Lands beneath the permafrost. Yeah. Another one I have to keep asking until you say the one that I put up there first. Fossil fuels. There you go. Yeah. So coal, oil and gas, fossil fuels. This estimate of 900 pettigrams, that's an estimate of how much is in the ground right now that's ultimately recoverable. There's actually more there, but it's probably will never be economic to pull out. So there's obviously uncertainty in this estimate, but there's about 900 pettigrams in the ground that we can probably get if we decide that's what we should do. Right now we're pulling out and burning about nine petagrams per year. Since we started using fossil fuels a couple hundred years ago, we've got cumulatively burned about 350 petigrams forest biomass globally there's about 350 petagrams in the vegetation. Most of that's in forests, and most of that is in the tropics. And that's where the most vulnerable stuff is now, or at least that's where the big change is. That's where deforestation is, removing some of that pool and putting it in the atmosphere. And the third large vulnerable pool is in soils. That's the biggest number, something like 3,000 petagrams. And as somebody in the front mentioned, the carbon and permafrost, that's a big part of it. About half of that is in the Arctic, locked up in permafrost. And that's actually the vulnerable part. As the Earth warms, the Arctic warms, the permafrost thaws, and some of that stuff will be liberated and be released as the greenhouse gases, carbon dioxide, methane. So for the rest of the talk, I want to focus on these two regions and talk about the work that we're doing at the Woods Hole Research center in these different places. And I'll start with the tropics. Some of you may have seen this map as you walked in. It's out in the big atrium on a marvelous set of screens there. So this is a map that was produced at the Woods Hole Research Center. It actually. It's amazing what you can put into a map. This is an immense amount of work by a bunch of people. There's satellite imagery that goes into this. There's lots of people on the ground in lots of different places, measuring how big trees are, estimating the carbon content. But what we end up with is in this, what we call the Pantropical project, is the estimate of the carbon content of forests in the tropics. And, yeah, just to explain the colors, the green in this map, it is a greater carbon density, denser forest, and yellows are intermediate, and red is the lowest. You can slice and dice this thing in all different ways. That's one of the wonderful things about gis. So this is often looked at from a national perspective, and that's really good for policy. How much carbon is in the forest of different countries. And that's very important for, say, the climate negotiations going on in the un. But nature doesn't generally recognize national borders. It does its thing not knowing if you're in Brazil or Venezuela or whatever. So I like to think about things slice and dice in a different way. And this watershed perspective. So here we show the watersheds of the two largest tropical rivers, actually the two largest rivers on Earth, the Amazon, and the Congo. And I want to talk about those for a bit now. So the Amazon River, a few basic statistics. It's about almost 6 million square kilometers. That's hard to picture, I guess, but there's California. So you can fit 15 Californias in the Amazon watershed. It's far and away the largest watershed on Earth. The discharge is around 6,500 cubic kilometers per year. Another number that's hard to picture. But to equal the discharge of the Amazon river, you have to combine the discharge of the next nine largest rivers on Earth. So the Amazon's just in a class by itself. Here's a really neat number. I think this is derived from that map I just showed you. The biomass of forests of the tropics. Amazon watershed has about 72 petagrams of carbon in its forest. And its soils are somewhere in the 55 petagrams of carbon here. The carbon in the forest, that's the vulnerable pool. That's where the change is occurring. That's where deforestation is going on. This is what much of this 6 million square kilometer area looks like. This just vast forest that goes on and on and on and on and on. The Woods Hole Research center has done a lot of work over the past many years in the Amazon basin. This is a site where lots of work was done. And you see these two towers. This is basically an observation tower, this is a flux tower. And there are all kinds of instruments on this tower measuring the concentration of carbon dioxide and methane and wind speed and temperatures. And you use this to figure out how the forest is functioning, how this intact forest is functioning. And just a few weeks ago, our director Eric Davidson, who's in the office, published a really important paper in the journal Nature that talked about the Amazon basin. And it used a bunch of data right from this site. But it also, the title of that paper, talked about transitions occurring in the Amazon. And one of the transitions that they talked about is what's shown here, which is the transition from intact primary forest to agriculture, the ag that goes on there. It's either pastures for grazing cattle or conversion to fields for largely raising soybeans. When I was here just a month ago, we did just a one hour flight from the town of Santarem, looping around and it was just amazing. In that one hour you see the intact forest, you'd see the deforestation, you kind of see all the phases of what was going on, including this part of it, which is this is being driven by global forces. So Cargill's a large global agriculture company. This is a, actually I don't know what you call this grain elevator or something, the conveyor. And I was hoping that there'd be a ship here when we flew by. There wasn't. But it's basically large ships that get loaded up with the soybeans, taking them to Europe or to China. When I got back home to my office in Woods Hole, I looked in Google Earth and there's the ship. So there's about a 500 foot ship that's almost certainly headed to China, China or Europe. A few minutes ago I showed the CO2 record, the keeling curve. And you know, the real strength of that is that it gives you this integrated signal about what is happening globally. This one point you can learn something about the Earth. And I've argued, and I will argue that I think that since that's taken, the next most important point measurement that one could make would be near the mouth of the Amazon river because it integrates over the next largest area. There's 6 million square kilometer watershed and discharge has been measured there. And when I was there last month, we met this guy, Mr. Nunez. He spends most of his time fishing, but for over 30 years, at seven in the morning, at five at night, he walks out of his hut, goes down and there are benchmarks along the bank of the Amazon river where he lives here near Obidos. And he measures the level of the river and those are the data that allow the calculation of, of discharge. So this guy's a hero of mine. Here's the data which I think should be called the Nunes curve. Interestingly, you see the seasonal ups and downs as you do in rivers, but you don't see a big trend. And part of me as a scientist is like, oh, that's come on, I want to see a change. And then I step back and think, actually this is really good. We don't want to change. So at the scale of the whole Amazon, we're not seeing changes in the discharge yet. We are also scientists at the Woods Hole Research center are doing detailed work on smaller segments of the Amazon where there might be a greater percentage of deforestation. And in those situations we do see big changes in the discharge. Unfortunately, there isn't a long term record of the chemistry of the river. And in some cases I think that may be a more sensitive indicator of change. Just in the last year, however, we've started monthly sampling that we, we'll do our best to keep going for the long term. So we will have that chemical record to look at as well. I Want to switch to the Congo? Now, I'm not going to say a lot about the Congo because you've already seen the video. I'm going to show some of these same numbers. So it's the second largest river, both in terms of watershed area and in terms of annual discharge. I'll just point out the Amazon was about 6500 cubic kilometers per year discharge. The number two is 1200 something around 30 petagrams of carbon in its forest. This is a publication, an ESRI publication that comes out I don't know how many times a week, quarterly. And this is a sneak preview for the next issue. And it just. It's an article about the work that we're doing in the Congo using Esri software, ArcGIS to look at how the water chemistry relates to the land cover. In addition to the work that we're doing now on the Congo river, the Woods Hole Research center has a long history of working on the forests of the Congo. Much of that is motivated by trying to keep the trees vertical instead of horizontal, and also working with the local communities to train them on how to measure the forest, help them think about how to manage the forest. Okay, so so far I've been talking about the tropics and the two largest tropical rivers. And now I want to shift my attention north to a region that I actually spend a lot more of my time. And I'll first ask, why the Arctic? Why be concerned about the Arctic? The first reason is something that I've already spoken about. The vast amount of carbon that's locked up in Arctic soils, which are permafrost soils, permanently frozen soils. The estimates, around 1500 petagrams. And again, as the Earth warms and the Arctic warms, that those soils thaw. And that carbon that's been locked up for thousands and thousands and thousands of years can rot, can decompose, releasing CO2 and methane. And this is sometimes referred to as a carbon bomb. This just vast amount of carbon that's been there slowly accumulating for a long time that may not stay there as the Earth continues to warm. Another interesting thing about the Arctic is that warming is greatest there. It's amplified. It's two to three times greater than the global average. So we see bigger changes there than we do elsewhere. And because of the greater warming and some particular sensitivities of the Arctic to warming, we're already seeing big changes happening. And some of those I've already mentioned, the permafrost is thawing, sea ice is melting, river discharge is Increasing. This is some work that we've done. There's been about. The Russians actually did a fantastic job of measuring the discharge of the rivers, the big Arctic river, starting in the 1930s. So we can go back 70 some years now. And there's been about a 10% increase in the discharge of these massive Russian rivers that we think that's related to warming. Warm air holds more moisture anyways, it's a signal of change at the large scale and changes in vegetation throughout the Arctic. Some of the work that we do at the Woods Hole Research center looks at the Arctic as a whole. This first figure is this project we call the Arctic Great Rivers Observatory, where we're working on the sixth largest rivers in the Arctic, four in Siberia, than the Yukon and Mackenzie in North America. And our work is down near the mouths of the rivers, close to where they empty into the Arctic Ocean or the Bering Sea, in the case of the Yukon. And we're interested in how the discharge is changing and how the chemistry may be changing. And so we're sampling the rivers multiple times a year. This project's been going, I guess, for a bit over 10 years now. And we're. It's all funded by the National Science foundation, and we're funded for several more years. Another project that's sort of at the panarctic scale is one that's looking at trends in the productivity or growth of vegetation. And this is a project that Scott Goetz, the deputy director of the Woods Hole Research center, heads up. And he's in here somewhere, I think, and what they do. Well, I'd say 10 years ago or so, the story was sort of developing that as the Arctic warms, the productivity of plants, the growth of plants is increasing. And that was work that was done on the ground, mainly on the north slope of Alaska up here. So I should point out the colors of the map. These sort of light green colors indicate areas where the plant growth is increasing. The red areas and brown areas are where it's decreasing. So the story had been that as Arctic warms, plants are growing better. And that was based on work that, you know, feet on the ground doing that kind of sampling on the north slope of Alaska. But when this work was done using satellite, and when you pull back and look at the whole picture, you see it's a far more complicated story. And what it basically looks like in a nutshell is the tundra areas are greening, the vegetation is growing more rapidly. The forest areas, the boreal forest, is showing the opposite trend. I want to now Focus in on the Kolima watershed, which is one of the places that we do a lot more detailed work and run through some of those general statistics that I've done for the other two rivers that we talked about. So the watershed's about 600, well, 0.6 million square kilometers. So a tenth the size of the Amazon watershed discharge about 130 cubic kilometers per year lower. These are still really big rivers, but not in comparison to the Amazon. 4 is carbon half pettigram compared to 70. So in the Amazon. But here's the, you know, the interesting number. When you look at what's in the soil, what's in the permafrost, there's a lot of uncertainty, this number, but this is, you know, this is a big number, 100 pettigrams. And that's sort of that, you know, why we talk about a carbon bomb that. Well, yeah, you know, it's built up for thousands and thousands of years, but how long it stays there is something we're interested in. This is what it looks like. You don't often get a view like this, but this is along the Coloma river where there's an eroding bank. So this is permafrost. And we've done radiocarbon dating of the carbon. And this is all 20 to 40,000 year old stuff. I've been to this specific site, I don't know, maybe six times. Each time you're there, you kind of walk along the bank for a bit first. And every time you find mammoth bones and woolly rhino bones and all this Pleistocene megafauna, it really makes you realize, wow, this has been frozen away for a while. We've sampled streams draining this area and we do radiocarbon dating, see how old that carbon is. And before we took these samples, the oldest dissolved organic carbon that had ever been measured was about 6,000 years old. Those were deep ocean samples. When we sampled the streams draining in this area, they ranged from 20 to 30,000 years old. So this stuff is thawing and it's being mobilized. And not only that, it's really tasty to the bacteria. So they're decomposing it, respiring it, releasing CO2 and methane. Did anyone hear the story that was in the news last week about some seeds, 32,000 year old seeds that germinated. This is where they came from. So they were these ancient squirrel burrows that were locked up in the permafrost. And those seeds actually were viable with a few tricks of biology. I love this area. This is a, I often call this A scientific playground. This is the Colomba river here. And we do a lot of work. There's a small scientific station in Chersky. And one thing we do, and there aren't that many scientists working there. It's kind of wide open. And there aren't that many American scientists who figured out how to do stuff in Russia. And so I guess it was five years ago we got a project funded from the National Science foundation to run a undergraduate field course there. It's really sort of a. It's a research. We call it a field course, but it's not a course. It's take a bunch of people there and do some research. And this year we'll have 33 people going. It's about 17 undergraduates from around the country, actually around the world. It's international. A bunch of scientists, some graduate students, a high school teacher, and we all go here. And what I want to show now is another video. It's a little bit shorter than the last one. It focuses on four students who went in 2009 and then returned in 2010. And it kind of talks about their experience.
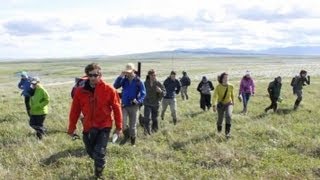
This is probably the most unique experience that a student could ever be a part of. To have the opportunity to travel to such a remote location is, in and of itself, incredible. And in addition to this adventure that you go on, you get to be part of an incredibly powerful and really, for a student, pretty advanced research experience. I loved the Arctic. Something about it really clicked with me. I'm applying for a Fulbright to do Arctic research for a whole year. The year after I graduate. The opportunity to actually come here gives you such a huge motivation. When I came here as a new student, I didn't know what to expect. I had had an introductory class in the Arctic processing, but I hadn't really seen it before or experienced it. And it was just something I'd read in a textbook. It wasn't real. It wasn't something that I can mentally picture and see. And then being able to see, see that and experience that has given me a perspective of what's here, what's important, what can be done. And working with the new students, it's really exciting because they have new perspectives, new ideas, new experiments, and then I can show them just what I've learned through the experience. So it's kind of like an exchange, a synergistic exchange. You go through experiences that, you know, some people don't even believe you that they happened. For example, we just went on this crazy tundra trip. You know, I was sampling water, but that was just a little of my day. The rest of my day consisted of swimming in the Arctic Ocean, watching a herd of caribou cross the mountain. You know, I sampled the river, but then we got to fish in the river, and then a storm came in and we had to sleep in a fisherman hut. But it was a great bonding experience and a great story to tell back at home. This experience actually has directed me in a way that I never thought I would go. I guess when I first started college, I never saw myself doing research in such a remote location or even pursuing a master's and possibly thinking about a PhD. I'm not sure what direction it's going to take me, but I'm really glad that I found something that I really enjoy doing.
Fundamentally, I love it here. I love this atmosphere of scientific inquiry. I love living in close quarters with such smart and excited people. If you listen to the conversations going on at all hours of the day, you can hear this constant potential, you know, this excitement. It doesn't really seem like there are many limits to what you can pursue here. The Polaris project, it's given me more faith in myself, I think, as fledgling scientists, because, you know, an undergraduate, you kind of learn some lab techniques, but you really don't get to implement them to try to approach a question that you've devised yourself. This program, in as much as it produces, you know, interesting science, I think it also produces confident young scientists. Sard, there's nothing wrong. So, as I said, we just recently selected the group for this coming summer. 33 people, but we'll be doing it again next year. The applications are due in January, so spread the word. You can go to the website and find out more information about this. And again, it's not just undergraduates, but it's, you know, it could be an elementary school teacher. We've had writers, we've had photographers. We have a pretty eclectic group and have a lot of fun. Okay, Wrapping things up and leaving hopefully some time for some questions. I want to get back to this idea that this really is an amazing time to be a scientist. I'm thrilled with my job. We have a lot of fun, but we also think we're asking some really important questions and sometimes getting some important answers. Again, it's a thrill for me to be sitting in this building because the. The software that these guys develop is a big part of what we do at the Woods Hole Research Center. Much of the work we do focuses on these large, vulnerable pools of carbon in the tropics and in the Arctic. Forests and in the soils. And just like esri, I think a thing that motivates us is understanding the world. And as we heard in the introduction, doing. Trying to do something about it. But we can ask, does understanding lead to change or does good science lead to good policy? I think in the best of all possible worlds, the answer would be a resounding yes. And it very quickly does. I think in the world we live in, it's not quite as rapid or quite as clear as that. But certainly one thing that unites us at the Woods Hole Research center is doing what we can to try to accelerate the path from understanding to change to good policy. We can step back a bit, though, and ask this question. Are there large vulnerable pools of carbon even directly under our control, or is there anything we can actually do about it? For fossil fuels, the answer is yes, they'll stay in the ground if we don't pull them out of the ground. It's not easy. I'm not suggesting that it'll be an easy transition. There are lots of forces that are encouraging us to pull it out. It's a fantastic energy source, but we can decide we're not going to do it and they'll stay put and out of the atmosphere for biomass, for forests, for vegetation. I think the answer is, well, it's partially directly under our control. And the part that's under our control is the deforestation part of it. And that's the big term right now that's causing carbon to be lost from the forests of the Earth. Us going out there and chopping them down. We can stop that if we decide to stop that. But increasingly, moving forward, I think there's going to be feedbacks from climate. As the Earth warms, precipitation patterns change. Forests can die because of that, or they can dry out and burn. There can be insect infestations. So increasingly, I think the ecosystems will change in a way that will cause forests to lose carbon and cause us to lose some of the control there. For soils particularly, I'm talking about permafrost carbon locked up in permafrost in the Arctic, I think the answer is no, it's not directly under our control. The carbon in the Arctic soils is lost because of the warming that's happening globally, which is being driven largely by fossil fuel combustion and secondarily by loss of carbon from forests. So the only way we can control what's keeping the carbon in the permafrost soils is by working on these other two terms. So one could ask, well, why even bother? In the Arctic. I think there are several good answers to that, and I'm glad that there are several good answers to that because that's where I do most of my work. But one, there's lots of uncertainties about the dynamics of exactly what is going to happen with the carbon in the permafrost. How quickly will that permafrost thaw? How quickly will the carbon in it decompose and release greenhouse gases when it does thaw? And those are the kind of questions that we spend our time trying to answer right now. I think another answer, though, is understanding what we can't control adds urgency to controlling what we can. That is, the more we learn about the carbon in the permafrost, the more incentive, I think the more concern there is and the more incentive there is to, to control these terms that we can control. This is my last slide. Just to sum a few things up. I think at the Woods Hole Research center, we're increasingly recognizing that watersheds are a fundamental unit of study. And by thinking from a watershed perspective, it enables us to more easily integrate the work that we're doing on land and in the rivers. And I think that's very important. We're a pretty small place, so we're not divided up in different departments and different buildings in the university. We can all kind of get together and decide we're going to, we're going to work on this and we're going to use the same language and we're going to work on this system. And I think thinking of the system in terms of watersheds really helps that process. The fact that rivers integrate over large areas or large rivers integrate over large areas aids in the detection and then the understanding of change. And one of the initiatives that is going on now at the Woods Hole Research center is this thing that we call the Global Rivers Observatory. We're already working on many of the largest rivers on Earth. I think it's seven of the top 10. The places where we're actively working are shown in the colored, colored watersheds. And we're hoping to expand to several other sites, rivers that we think are very interesting. And some of those are shown in gray. So I think I'll stop there. I'll thank you all for coming and paying attention and I'll try to answer any questions you might have.
Okay, if you've got A question for Dr. Holmes, please raise your hand and we'll bring you a microphone. I'm going to be running and talking at the same time. I don't know if I can do that or not, but it looks like my colleague over there is going to get the first microphone. And please remember to introduce yourself. Jack's not here tonight, but he's going to find out if you don't introduce yourself. So you got to introduce yourself before you ask your question. Okay.
I'm Stephen Heckman. I'm a California registered professional forester. Not actively doing that anymore. My question is, is Woods Hole doing.
Any work on this distinction between CO2 deposits and what may be emitted as.
Methane from Arctic frozen resources and the volume and magnitude of the effects on global warming that that methane will have over carbon dioxide? Yeah, that's an excellent question. Yes, we're doing some work and we're very interested in doing more work on that very question. Just a little bit of background for the audience. When organic matter, when a plant decomposes, when this carbon in Arctic permafrost or anywhere else decomposes, it can go off as carbon dioxide. One carbon, two oxygen. It can go off as methane. One carbon, four hydrogens, each one carbon molecule. But the methane has about 25 times the global warming potential that the carbon dioxide does. So the balance between carbon dioxide and methane is incredibly important for determining how much warming will actually be generated. And in the Arctic in particular, there are conditions that can favor the production of methane over. It happens in various places, but certainly the Arctic, you can get a lot of methane going off. So that's. Yeah, it's a really important question. It's one we're very interested in. It's one we'll be doing some work on in July when I'm in Siberia. Yeah, thanks.
All right, we've got another one, I think, over here. Thank goodness for these wide aisles.
My name is Chris Claudis. I'm a school teacher. You talk about carbon trapped in soils and then carbon trapped in natural gas and oils and like that. What do you call carbon trapped in Canadian shale? Oil. Yeah, that's a good question. I mean, it's fossil fuels. I would put that in the fossil fuel pool, but. That's right. A lot of it is in soils that I guess are relatively near the surface. I don't know that much about it, but yeah, I'd put that in my fossil fuel pool, but it is an interesting kind of in between.
All right, you take this one. I'll go down toward the front. She'll make it before I do. So, I'm Nancy Sidhu, and I wondered if you worked at all with the Woods Hole Oceanographica. Part. Not part, but organization and particularly since the ocean is. I mean, carbon and the ocean are really, really important. And what's happening in the ocean with carbon.
Yeah, so we do work with the Woods Hole Oceanographic Institution. Woods Hole is a really small place, and just about everyone who's not there thinks we're all one place, and I certainly did before I went to Woods Hole 15 years ago. But in fact, it's several independent research organizations. The Woods Hole Research center is one. Marine Biological Laboratories and other Woods Hole Oceanographics and other. Historically, there hasn't been a lot of interaction between the different organizations, but I think that's changing. There's now something called the Woods Hole Consortium, where we bring all three institutions together. This Global Rivers Project has pretty much equal representation between scientists at the Woods Hole Research center and the Woods Hole Oceanographic Institution. And I think it shows an advance in the oceanographic community that they're recognizing the importance of rivers and by extension, the importance of land. It actually does influence what happens in the ocean. So we actually have funding from NSF for this Global Rivers Project that comes from the Chemical Oceanography Program at nsf. So, yeah, we're increasingly working with people at Whistle Oceanographic. You mentioned carbon in the ocean. There's vast quantities of carbon in the ocean. I don't spend nearly as much time thinking about it, but I think it's probably safe to say while it's large, it's not particularly vulnerable. That is, we're not going to start losing big quantities of it. I hope there aren't too many oceanographers that call me on that one in the audience.
I'm Barbara Murray. I'm the director of the center for Science and Mathematics at the University of Red Language. And you mentioned something about it in the Congo, your little movie, but you didn't say anything about it in the Arctic. I'm interested in when you go into Russia, the politics.
How easy is it to study those?
And also in the Congo, have you sort of fixed that or.
Every place has its peculiarities, including our very own United States of America. Russia's a tricky place. Where we work in Russia. Well, we work in a lot of different places in Russia, but where the Polaris project is and the Kolyma Watershed is what's known as a closed region. Even for a Russian to go there, they have to get special permissions. So there's lots and lots of layers of permissions to go through to just get there. And then if you want to bring samples out or bring equipment in, there are many more layers of permission. So Russia is really tricky. Brazil is pretty tricky. And I think that's in part because those countries kind of have it together. You go to, well, let's say the Congo is more freewheeling and it's. Well, you know. Yeah, things are more flexible there. And even Venezuela, it kind of seems that way. So, yeah, there are challenges everywhere. But I do remind myself that, you know, we always get our visas going to Russia or whatever. And there are many examples of Russian scientists not getting their visas coming here. So they don't have it easy either. Hi, my name's Kent, I work here at ESRI. I have family that lives in the McKenzie watershed. And I was wondering where you actually did the data collection and if you could speak about the health status of the watershed. Yeah, so in all these rivers we go pretty much as close to the ocean as we can above tidal influence. So the sampling on the McKenzie is at Sigachik, which is near Inuvik. Inuvik, you can fly into Inuvik. It's in the Mackenzie Delta. Sikachik is just above the delta. So it's the, you know, before it branches out in a bunch of different channels, it's a Gwich' in community of, I don't know, a couple hundred people. The Mackenzie's an interesting river. It's kind of an outlier among the Arctic rivers. If I showed the hydrograph, the discharge of the Mackenzie, or typically an Arctic river, very low flow in the winter and then it shoots up in just a matter of a few days to its peak discharge and then comes down quite rapidly. The Mackenzie has some big lakes in the middle of it that attenuate that. So it's not. It's a very different shaped hydrograph. It also has much lower dissolved carbon flux. A lot of our work is on the carbon, much lower dissolved carbon flux, but a pretty high particulate carbon flux. So it's very sediment rich system. I don't know if this is quite getting at your question, but we don't. On the North American rivers, we don't have long time series. On none of the rivers do we have long chemical time series. The Russian ones I mentioned, we have discharge records that go back 70 or more years. Now on the big North American rivers, the Yukon and Mackenzie, we didn't start measuring the discharge until the 1970s. And because of big sort of interannual variability, it's hard to really detect a trend until you get a longer data set than that. So we're not as sure really about. Surprisingly, we're not as sure. About changes that might be going on in the Mackenzie as we are in the rivers in Russia.
Hi, I'm Jane Roberts, longtime resident of Redlands. Two things with 7 billion people on the planet now and 9 billion and more prosperity, more development. Human beings are rapacious species and I really can't. I haven't seen human beings on a grand scale wanting to lessen their level of living. So would you comment on that?
And then secondly, no.
And secondly, do you testify at all before Congress? I mean, comment on how in the world can we get world governments, and particularly maybe the United States government to translate good science into good policy?
Does anyone else have a question? Let's see. The United States government. Oh boy. Where to go with this one. One really positive thing I'd say is our ex director John Holdren was our director until right after Obama got elected and Obama asked him to be his science advisor. So there's some really good. And there's some really good advice at the upper levels of our government. I think we were all incredibly optimistic. We all hated to see him go, but we thought this is a good thing for the country and we were optimistic at that point. I think we're all a bit disappointed by not as much progress as we had hoped for. I think the efforts there, I think the challenges are immense. And you mention some of those challenges. You know, I don't know. It's a magic. I don't have the answer. I think we keep working. I think education's a big part of it. I don't know that there's. We're going to turn the ship tomorrow or the next day or next year, but I think. Well, one reason I love to come to a place like this is just to talk to people. And I think we need to keep doing that. I think we need to talk to kids. I think, you know, it's going to take time and we just have to approach it from as many different angles as we can. I think understanding how our world works is a huge element. Communicating how it works and then hopefully from my perspective, wiser decisions will be made. Yeah, population's going up. Everyone wants to live like we're living. I can't blame them. Yeah, immense challenges, but I remain optimistic. There are good people working on these problems and we keep plugging away. I wish I had a, you know, I wish I could just give the quick answer, but there isn't one.
Okay, why don't we take one more question right here. We'll let you have the last question.
Thank you. My name is Richard Schenck. I'm a freelance writer, and I'd like to find out. I actually have two questions. First of all, where can I get more information and see a GIS map that's similar to this, but puts your data into that map? And then the second question is that.
The work that you're doing feeds directly.
Into arguments for the idea of global warming or climate change, whichever of those terms you prefer.
And where do you see the greatest.
Scientific detractors to the information that these pools of carbon dioxide and methane really will and are contributing to global warming and climate change? The greatest scientific. Could you elaborate? I'm not sure what you mean by the greatest scientific detractors. Well, as you know, certain administrations have brought forth scientists who. Do I need to say more? Yeah, I see where you're going. Thank you. I think I see where you're going. I mean, it's. Boy. Boy. These last two questions. Where can you see some of our stuff on maps? There's some right outside here. There's some on the website of the Woods Hole Research center, which is whrc.org I'd encourage you to go there where there's a bunch up. We're constantly producing more maps, more displays of our data. Talk to Greg Fisk, who's sitting right here, who's the guy that actually makes most of those maps. And I think that was the only question you had. Right? Something just brief. Boy, where are the. I do the science and I talk to the people about the science. I tell them what I see and I tell them what I learn and take it from there.
More from Tod
WHRC's Sustainable Science Speaker Series - Dr. Toby McGrath speaks on Sustainable Fisheries