Rough Weather Ahead with Dr. Jennifer Francis
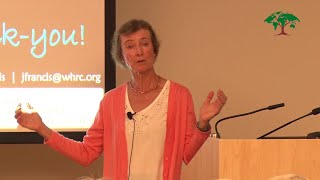
Dr. Jennifer Francis explains how Arctic warming weakens the jet stream, making weather patterns stick around longer and intensify. She walks through 2019's extremes: heat waves, floods, wildfires, and Greenland melting at unprecedented rates. Without emissions cuts, the Arctic could be ice-free in summer within decades.
Chapters
Well, thank you very much, Dave, and thanks to all of you for coming. It really is an enormous pleasure for me to be able to introduce Dr. Jennifer Francis to the group tonight, even though she may well be one of those people who needs no introduction. I'm going to give her one anyway. She got her PhD in atmospheric sciences from Washington University.
University of Washington.
University of Washington. Yeah. There is, there is a Washington University in St. Louis, it's true. And the University of Washington is a center of outstanding work in atmospheric sciences, climate change and so on. She has worked at various stages of her career at the Ames Research center, at the Polar Sciences center of the University of Washington, and for the longest period before coming to the Woods Hole Research center at the Institute for Marine and Coastal Sciences of Rutgers University in New Jersey. She has published an amazing array of pioneering studies in how climate change is affecting the Arctic and how climate change in the Arctic is affecting the rest of the Northern Hemisphere and in some respects, the world. But I want to tell a personal story about Jennifer Francis. When I was President Obama's science advisor, there were a series of unusually cold winters in New England and up and down the eastern coast of the United States. And I had been reading Dr. Francis work, never having met her, on a very interesting hypothesis as to how this might be related to global climate change, namely that a shrinkage of the temperature difference between the mid latitudes and the Arctic, which resulted because the Arctic was warming more rapidly than the mid latitudes for reasons that are quite well understood, that that change in the temperature difference was weakening the jet stream that encircles what is called the polar vortex, which is a great swirling mass of cold Arctic air. And the weakening of the jet stream was making it wavier. And in the downward lobes of the wave, cold air from the Arctic was able to penetrate unusually deeply into the mid latitudes. And in the upward lobes, warm air from the mid latitudes was penetrating unusually deeply into the Arctic. And so one was simultaneously experiencing extraordinarily high temperatures in some parts of the Arctic while we were experiencing unusually cold temperatures in parts of the mid latitudes. And in the particularly cold winter of 2013, 2014, Senator Inhofe of Oklahoma threw a snowball in the Senate to demonstrate that global warming is a hoax, that it's Snowing in Washington D.C. global warming can't be real. And President Obama asked me if I could explain what was going on. And I actually had the temerity to initially write and then to phone with Jennifer Francis to get a better understanding of her results. And then I briefed these ideas to President Obama and Obama said, you need to brief these to the nation. And so I did a two minute video for the White House that was really based above all on Jennifer's work, which went viral about how you could, as a result of global warming, have cooling in winters in the Eastern United States. That went viral to the point that I actually was sued by the Competitive Enterprise Institute. We won't go into that in any great detail, but Jennifer was an enormous help to me on these issues while I was President Obama's science advisor and advising him, among many other things, about climate change. And I just thought it was an enormous coup when the Woods Hole research center attracted Dr. Francis as a senior scientist in October of 2018. She is a prize. She is a superstar. And I'm sure you will all enjoy the presentation to come. Jennifer.
Wow.
I'm not sure I'm going to be able to get my head through that door to go home tonight. Thank you, John. It's a real honor to be introduced by you. And I got to tell you, when you sent me that email asking for some information about my research that time I stopped breathing for a good five minutes, I'm pretty sure, and kind of fell off my chair. And it took me a while to get my head back in the game and actually figure out what I was going to say back to you. So anyway, it's been a great ride. All right, well, thank you all for coming on this. The last few hours of this day that turned out to be sunny and you could have been out there enjoying that instead of being here. But I'm really glad you're here. And as Dave mentioned, this talk is loosely based on an article that I published just this past June in Scientific American. There weren't any issue little reprints of it out there and you would like to have one. Just send me an email or let Dave know and I can make sure you get a PDF of it. But it was a fun project working with Scientific American, looking at more broadly. I mean most of my work has been about the Arctic and how the Arctic is affecting mid latitude weather patterns. But this article was looking at more generally how climate change is affecting extreme weather around the Northern Hemisphere pretty much. So let's just dive into it. Mother Nature is providing lots of interesting examples and just in 2019, just this year, we've had all kinds of extreme events happening. So just to take just a smattering of some of them, think back to January when the polar vortex attacked the Midwest Again and they were plunged into a big deep freeze and they broke all kinds of low temperature records on some of the lured shores of the Great Lakes. These homes were just encased in ice because before this it was warm and so the Great Lakes were still ice free. So the winds picked up that moisture and threw it at the houses on the downwind side. And meanwhile, all across various mountain regions of the Northern hemisphere like California had record snow, or some of the Rockies, Montana had record snows and even parts of the Alps had record snows. So there was a lot of heavy snow. Then as we progressed into spring, we saw a couple of flooding events in Maryland and the Midwest got whacked again. You'll remember the bomb cyclone. We talked about bomb cyclones the winter before. But this winter the Midwest experienced their very own bomb cyclone and followed by a spate of tornado, just sort of round after round of tornadoes and severe thunderstorms. So these little triangles here are tornadoes and the purple ones are severe thunderstorms. So they just got whacked over and over again. The result being that the Midwest, much of the farmland in many of the states along the Missouri river are still flooded and they haven't been able to plant crops this year. It's a really serious problem. And then as we progressed into summer, we saw the first European heat wave hit in June, followed by another one in July. It was record breaking. It's done a lot of damage to health. A lot of people have really suffered over there. They don't have air conditioning routinely like we do. It's been really difficult. That heat wave then moved north and west a little bit up to the uk. They had their own heat wave and it kept on going up to Scandinavia where it sparked a lot of fires up in the tundra. We saw also fires in Alaska this summer. They're still going on. And even northern Siberia, there's just been huge wildfires going on. And then Greenland, Greenland has been having probably, it may tie 2012 for the most melt that we've ever seen. This is the surface of the Greenland ice sheet this summer. And you can see the liquid water just pouring off of it. You'll also notice the dark snow on the COVID there on the surface of the ice. That's probably connected to the smoke that's coming from a lot of the fires in the high latitudes that's being deposited on the snow. And of course it makes the snow dark and it absorbs more solar energy which melts that snow even faster. So we're waiting to see if this Year is going to be a new record for Greenland melt. And then of course around here we had our own tornadoes. Three tornadoes in Cape Cod, which is just nuts. And you know, it's probably a one off, but hey, it could happen again. But this is just an example year of something that's been happening over the long term. This graph is produced by an insurance company. It's not scientists doing this. Well, they do employ scientists, but they keep track very closely of extreme events because of course they have to pay when stuff gets damaged. So what you're seeing here is going back to 1980 and looking at basically four types of extreme events and their frequency around the world. And what I want you to notice is the red bars here are extreme events that have nothing to do with weather. So things like earthquakes and tsunamis and volcanoes and stuff like that, but the other colors there are all weather related events. And what you see is the non weather related aren't changing over time. The weather ones certainly are, they are getting more frequent with time. So it's not your imagination. The weather really is getting more extreme. But the question of course is how is climate change making this happen? I mean, I don't think there's any question that it is playing a role. But what we need to figure out is exactly how and which types of extreme events. And really where the rubber is really meeting the road in the research right now is being able to say with some certainty this event was much more likely because of climate change and how much more likely, or the rainfall in this hurricane, for example, was this much worse because of climate change. So that's some of the questions that we're trying to answer. But there are some clear connections between climate change and extreme weather that we can talk about. The first one, of course, and it's pretty easy to understand, is heat and heat waves. And of course those are also very intimately connected with worse droughts and worse wildfires. So this is pretty easy if you look at how the distribution of global temperatures has changed. This schematic gives you a pretty good sense for how this works. So before the average temperature was of course, much cooler than it is now. And what you see is that not only does the mean temperature of the globe change, but it also changes the frequency of the extreme events. So we see fewer extreme cold events, which is a good thing. Although we've got a little story about that, but I'll tell you later. And we obviously see more extreme heat events. So heat waves and heat waves are getting more frequent, they're getting longer and they're getting more intense. And this is pretty easy to see this. And we can also see it in how the global temperatures have been changing lately. Five of the five hottest years have occurred in the last five years. And you can see that we're butting up against this line up here, which is getting pretty darn close to that 1.5 degree threshold that the Paris Agreement is trying to keep us below. So we're already getting very close to that. And it looks like 2019 is also going to be in this hottest years category, maybe the hottest ever. But how does that compare with what's gone on in the past? Well, let's look back 20,000 years to the last Ice Age, which was about 20,000 years ago. What I want you to notice is the difference in temperature from today, which is the zero line here, is only three and a half degrees. It's really not that much that makes the Earth change from a glacial state or an ice age state to a warm state. It's really not that much. So when we talk about the Earth warming a degree and a half and then we're almost there, that's a lot. That's a lot in the grand scheme of things. So the last ice age was about 20,000 years ago. The last, what we call an interglacial or warm period was about 8,000 years ago. And these changes we know are all just due to natural causes. We understand why the climate system has changed in the past, but when we start looking at recent times, that's where we are today. It doesn't look anything like anything we've ever seen going back in the past record of the climate system. That's scary all by itself. But when we look at what we're heading towards by the end of the century is something like that. So this is not a good scenario. And of course, this part of the graph is because of what we are doing. Notice we would have been on a cooling trend due to natural causes. But obviously that is not the story anymore. And we can also take a look at how the warming is distributed around the globe. It's not even. Not everywhere is warming the same amount. And what jumps out. So this is the temperature difference from what we call climatology. So the previous 30 years and these warm colors are telling you that it's warmer than it used to be back between 1961 and 1990. And obviously where the warmest place is happening, as John already mentioned, is the Arctic. And I'm going to come back to this because this is in important point. And this is an interesting graph that just came out yesterday. It was produced by the Wall street, sorry, the Washington Post, and it's looking at how temperatures have changed around the United states since the 1980s, and pointing out the fact that many regions around the United States are already exceeding that 1.5 or even 2 degree threshold that the Paris Accord is trying to keep us below. And if we zoom in on New England, we're actually in the danger zone here. We're seeing these really warm temperatures right Even here in Falmouth, we're in the red probably because, as you'll see soon, the ocean temperatures off our coast are also very warm. And that's contributing to this extra warming that's happening along the coastal areas. So lots of bad news in my talk, I'm afraid tonight we will try to get to some happy stuff, but there isn't a lot of good news, I'm afraid, right now. But you're in the right place to hear about good news, because that's what's going on in this organization. So if we look at how the daytime temperatures have changed around the United States, this is showing the fraction of of the United States that has experienced extremely warm daytime highs going back to almost the beginning of the 1900s. And yes, you can see there was a spike back in the 1930s, the Dust bowl era, but a much bigger spike happening more recently. But interestingly, you see a much stronger trend when you look at the change in the minimum temperatures at night. So how cool does it get at night? And that is really going up, which is bad news again, because the nighttime temperatures are really what get people who are vulnerable. So if you don't have air conditioning and these temperatures are happening, this is when you really run into some health consequences. Your body just is unable to cool itself if you don't have air conditioning. And tied in with this story here is the fact that there's a lot more moisture in the air now. And so on top of these extreme temperatures, we're also seeing the humidity increase at night. And that makes it even harder for your body to cool itself, which is a good segue into my next strong connection between climate change and extreme weather. And that is the moisture in the atmosphere. So this is looking at your Earth and how water vapor, which is the gaseous form of water, exists around the planet. This was just like two weeks ago. We can measure the amount of water vapor in the total atmospheric column using satellites. And we can create an animation like this.
And can you.
And you could stare at this for quite a while and see all kinds of cool things. There were a couple of hurricanes spinning just east of Hawaii there. You can see there's a lot of water vapor that's been entrained into those storms. You can see this big storm wrapping up in the North Atlantic here. You can see how water vapor is transported northward by these big storms. All kinds of cool stuff. You can see the tropical western Pacific is just like loaded with water vapor. So if you go there this time of year, it's really not very pleasant because it's pretty much a tropical downpour every day and the atmosphere is very, very humid. This other plume right here of moisture heading right up into Alaska, this has pretty much been there for most of the winter and spring. This, this is a circulation feature that has been bringing all that heat and moisture up into Alaska. And Alaska's had its warmest winter and spring pretty much on record. In July they just set an all time record for Alaska. So kind of cool, but it's not so cool actually. So one of the reasons, or the main reason why we're seeing all this extra water vapor in the atmosphere is because the heat trapping greenhouse gases, most of that heat goes into the ocean, like 90% of it. What you're looking at here are the differences from normal in ocean temperatures as of today. This is today's map of ocean temperature differences from normal. What stands out are these big red blobs. These are not small numbers. We're talking about 5, 5 degrees Celsius. That is huge. If there are any oceanographers, Gus will tell you that is a huge amount of warming for the ocean. And we've got really warm waters off of our coast here. But out in the North Pacific, it's just ridiculous. And all around Alaska it's just been on fire and around Greenland as well. And those really warm ocean temperatures have been contributing to that melt on Greenland that I mentioned and also to this record warm conditions that Alaska's been having. But warmer oceans evaporate more water into the atmosphere. And that's mainly why we're seeing this big uptick in water vapor around the globe. It's about a 7% increase going back to the 1970s or so. A 7% increase in water vapor goes pretty hand in hand with a 1 degree increase in air temperature. That's a pretty solid physical relationship there. And this is a big deal. Water vapor doesn't get enough play in my view, in the press, because it does a lot of important things. First of all, it is the fuel that hurricanes and other storms use to both create their winds, but also, of course, to create precipitation. And also, water vapor is a greenhouse gas, just like carbon dioxide. So if you put more water vapor in the atmosphere, you're increasing that heat, trapping that the greenhouse gases are doing as well. So it's a magnifier of global warming, if you will. But the other thing is, as I mentioned, it also adds to precipitation in storms. So what we're seeing is a very clear signal of increasing heavy precipitation events, especially here in the Northeast. So these are changes in the frequency of these heavy precipitation events just since the 1950s. So that is a huge signal directly connected to climate change. If anybody has a question along the way, please feel free to yell or stick your hand up or whatever you want to do. So when we start talking about hurricanes now, that water vapor, again, is a really important piece of this story. So that water vapor, as I mentioned, fuels these hurricanes and all storms. We're seeing a very clear signal of more rapidly intensifying hurricanes, and we're seeing storms that dump just a ton of rain. And here are a few examples of some of those really heavy precipitation producers. So you might remember Hurricane Irene that came up this way and, and dumped 9, 10 inches of rain, did all kinds of damage up in Vermont and upstate New York. Irma, not so long ago, dumped over a foot of rain in Florida. And probably the poster child is Hurricane Harvey that fed off of these very, very warm temperatures in the Gulf of Mexico, came into Houston and dumped literally 40 inches of rain. I mean, that's this much rain. This is a lot of snow, but this is an amazing amount of rain. So there are a lot of cases now where we're seeing these hurricanes just put out way more precipitation. So there are other connections now that are not quite so solid. I'd call them dotted lines. Maybe. This is where my research comes in that John started talking about a little bit. There's a hint in the background here. We're going to start talking about the Arctic a little bit and getting back to this picture showing how much faster the Arctic is warming than pretty much anywhere else on the planet. And this, as John mentioned, is a very big deal. So one of the reasons it's a big deal is it's associated with the loss of sea ice in the Arctic Ocean. So here's Greenland here. Here's northern Canada. There's Alaska, Siberia up on top. This animation is showing you how the thickness of the ice floating on the Arctic Ocean is changing. Just since 1979, the colors that are orange and yellow are the thick old ice that's been up there for years. The bluer colors are the thin new ice. And what you notice as you watch this animation progress is that when we get to 2017, there's almost no old thick ice left. It's basically gone and it's disappeared in only 40 years. I mean, that is ridiculous on the climate time scale. Now we look at how this sort of transpires on a seasonal type cycle. So here we are going from January through the year. Okay, this is how we're looking at the volume of ice now. So this is the area in the Arctic of ice times the thickness. So this is how the volume has been changing over time. The bluer colors are the 80s and 90s. And as you get into the red colors, you get into the more recent years. So what you notice is that of course the ice grows during the winter. It reaches a peak around April sometime, and then it starts to go through its melt cycle. Here we are today. We're very, very close to the all time record low amount of sea ice volume that was set back in 2012. And we think we have a really good chance of beating that record this year. We've got another month or so, maybe three weeks until we reach this bottom, which usually happens around the middle of September. But it's a pretty clear, stark signal. And the reason this is important is because as we look at what the ice cover looked like back in the 70s, and here's Greenland, here's northern Canada in the summertime, which is when it reaches that minimum coverage. That's what it used to look like pretty reliably every winter that year where we hit the record. And it looks a whole lot like that now. We lost all this red stuff. Here is where the ice is missing. So literally there's half as much ice now in terms of the extent as there was just back in the 1970s. And the reason that's important is because when you lose that bright white ice, and that bright ice reflects most of the sun's energy that hits it instead. All that energy now goes into the ocean. Before, it never entered the climate system at all. It just went right back to outer space. Now it's going into the ocean and so it's heating up that water, melting more ice, exposing more dark water. This is a vicious cycle and it's the main reason why the Arctic is warming so much faster than anywhere else because of this vicious cycle that happens associated with sea ice. So it's having a big impact. The Arctic is darker now. Literally, it's like a mirror, and we've lost half of the mirror. It's also the Earth's mirror. And because we've lost all this sea ice, there's been recent research that suggests that Global warming is 25 to 40% stronger because we've lost the Earth's mirror. So if the Arctic were all land, we wouldn't have this effect. Global warming would be smaller. But because of this, it's having a global impact on warming. So going back to temperatures in the Arctic now, we're looking at just the change in temperature during the winter months, and that's when this extra warming that happens in the Arctic is largest. Here again, we've got Greenland and Norway here. Just to get you oriented. Here we are over here, and there's Asia on this side. And you're probably going, wait, where are those blue places? Those blue places are actually cooling while the Arctic is warming so much. How could that be? Well, let's think about why it matters that the Arctic is warming so fast. If you think about a layer of air that extends from here in Falmouth up to the Arctic, we know that air that's warm expands and cold air contracts. And so this layer of air is actually going to be much thicker here in Falmouth than it is up in the Arctic. So that's what that layer might look like. And if you were sitting on top of that layer and you were looking towards the north, it would look like you were looking down a hill. Well, air sitting on top of that hill wants to flow down just like water wants to flow down the side of the mountain. So that creates a wind towards the north. And because the Earth is spinning, that wind gets turned to the right in the Northern hemisphere. Everything that moves gets turned to the right in the Northern Hemisphere. All right? So this creates this river of wind high over our heads that we call the jet stream that you probably see on TV weather forecast sometimes. That's why the jet stream is there, because of this cold in the north, warm in the south. Now think back to what's happening in the Arctic, as John already alluded to, because the Arctic is warming so much faster than that layer is getting thicker, faster in the Arctic. And so that hill is actually getting less steep. And so the wind that flows down that hill is not as strong, and that weakens the winds of the jet stream. Now, a weaker jet stream, we know, tends to take these bigger north, south swings as it goes around the Northern Hemisphere. It's more easily diverted from Its path, just like if you thought about water flowing down a steep mountainside, it would tend to go really fast and straight. And if there was a boulder in the way, it would pretty much go straight around it and not get diverted very much. But when that same river gets out to the coastal plain, where there's very little slope to the land, you've all seen it. These rivers take these big meanders left and right. Well, the same kind of thing happens to the jet stream when it's weak. It's more easily diverted by mountain ranges and even by temperature differences out in the ocean and things like that. So we tend to see these bigger loops in the jet stream. And here's a couple of examples of what this might look like. Kind of schematically, this is an example in 2013, in November. You see here's North America down the bottom here. We've got all this cold air bottled up by the jet stream over the Arctic. And you can see the jet stream is relatively straight in its path going around the Northern Hemisphere. But when the Arctic's warm, in this case, this is the attack of the polar vortex. That jet that John mentioned in late 2013 actually is January 2014. And what you notice is the cold air has migrated towards the south. And again, taking these big, wavy patterns in the jet stream, this particular one is the one that caused all that cold air to swoop down over Washington, D.C. and give Inhofe the idea of throwing a snowball in the Senate floor. So the idea here is then, that when the Arctic is warm, we tend to see the jet stream take this wavier path when it has these big waves in it. Those big waves tend to not move very fast. They tend to stay in one place for a long time. You're sitting there thinking, well, okay, big waves, fine, I get that. It allows the cold air to go really far south, and they move slowly. Okay, so why do I care about that? Turns out those waves in the jet stream are what make weather. They make the highs and the lows that you see on a weather map. And here's kind of a scenario of how this works. So here's a typical jet stream in the winter. It separates the warm air from the south from the cold air that's to the north. And these different parts of the wave are what create the upward motions and downward motions in the atmosphere that create the highs and lows that we see on the weather map. So this part of the wave, where the winds are coming from the northwest, is where you tend to find blue skies and high pressure and nice weather. Whereas over here, where the winds are coming from the southwest and bringing that tropical moisture up from the south, this is when we tend to get our nor' easters in this area and a generally stormy pattern. So whenever you see a jet stream on a weather map on tv, you'll be able to say, oh yeah, this part, that's where the high pressure is. And over here, that's where all the storms are happening. So that's generally the case. Unfortunately, the real world is so not neat and tidy. It is a God awful mess. So this is what the real jet stream looks like. These yellow red colors are the strong winds high up in the atmosphere. These are actual wind measurements. And what you can see is just all kinds of swirls and waves and it breaks off into little eddies. And so you can imagine how difficult it is to try to get a handle on how the jet stream is changing over time. But you can see there are times when the waves are little and they tend to move pretty quickly across the continent. And then sometimes they're very large and you can see they get stuck in one place for quite a while. So that's kind of a bottom line, if you will. One of the ways we think the Arctic is affecting weather patterns is to make them more persistent because these waves tend to sit in the same place for a long time. I know it's kind of hypnotic. I've seen it many times and I always love to look at it. So just to give you a little taste of how we're trying to approach this problem and figure out whether in fact these really wavy patterns are happening more often or not. Given that mess I just showed you, here's one of the ways we're going about it. It's just a very simple way, but it actually seems to be bearing some fruit. So you can see North America in the background here. Here's Mexico, Alaska up there. So we look at. Go back to think about that layer in the atmosphere as I that I was talking about. That's thicker here and thinner up in the Arctic. Well, this plot is showing the thickness of that layer, just like a topographic map that you'd use for hiking. So where these colors are red is where the layer is really thick. Makes sense. Right to the south where the air is warm, and up towards the north where those blue colors are, it means the layer is much thinner. So it immediately tells you where the warm air is and where the cold air is. And these lines are like on a hiking map. It's where you can walk and stay on the same elevation if you were on a hike. So we can take this type of information, and every single day we can pick one of these lines that is in the area where the lines are closest together, which, if you're a hiker, you'll know that means that the slope is really steep right in the mountains. That's also where the winds of the jet stream are the strongest. So we can follow one of those lines and every day measure how far north it goes and how far south it goes and come up with some threshold that says, oh, that's a really big wave, and then just count them over time. Really pretty simple. And what we're finding is that when we look at the frequency of these very wavy events, that's the green line here going back to the late 1970s. And this is around the entire Northern Hemisphere. We're seeing the frequency of these very wavy patterns clearly going up at the same time. This dotted black line here is the speed of the west winds of the jet stream, which is clearly going down. And if we zoom in on just the North Atlantic, which is what we care about around here, the difference or the change is even stronger. So we see a very distinct increase in these wavy patterns and a very strong decline in the speed of the winds. This is just to give you a sense of one of the many ways we're trying to get at understanding how the jet stream's changing and ultimately why. So just to look at a couple of examples, you might remember, in the winter of 2018, we had some really cold temperatures around here, especially in Florida, where they don't appreciate snow at all. In fact, the iguanas there really didn't appreciate this cold weather. They were falling out of the trees in cold comas. They weren't dead. They came back to life. Don't worry. So you can imagine what the jet stream looked like, right? It was really cold in Florida. So here's what the jet stream looked like during that cold event. So we had this big, what we call a ridge out in the western part of the country, all this warm air surging up north, and then a big dip or a trough, we call it, in the jet stream over the east. And that caused all let all that cold air from the Arctic plunge way far south. And then the very next week, we had what we call weather whiplash. And that's when you go from one very persistent weather pattern. See, this was early January all the way through mid February, lasted a long time. Big wave, persistent, right? And then it Flipped and what did we have? We had record breaking heat all the way up to Maine. People were swimming in Boston. This was February of 2018. What did the jetstream look like? You can predict it, right? Big dip, big trough out west, big ridge in the east. Just what you'd expect. So this spring when we had all that crazy weather, it was really warm in Alaska, it was snowing like crazy in California, the bomb cyclone was hitting the Midwest. And then all that surges of tornadoes that came through, this is what the jet stream looked like. It was a huge ridge over Alaska. It was there most of the time through winter and spring. And then we had this big trough out west. So it was cool for a long time. Out west. We had a heat wave, May, June, down in Florida, where I was living at the time. It was absolutely miserable. And then we had all those tornadoes and flooding that happened in the middle of the country. So just to drive home this idea that the jet stream is everything when it comes to weather, and when it gets in this very wavy pattern, you can expect those weather conditions to stick around for quite a while. All right, so getting towards the end here, thought we'd look into the future a little bit. So this is where the story gets interesting because we have choices. This is a pretty cool graph, I think, showing how the Earth's temperatures have changed in the past. So that's up until the middle of the page here. This is where we are now. And the colors, of course, the red colors are warmer than the blue colors. You can see that we've already warmed up quite a bit as I showed you in the beginning. But then from now on, we have choice. We have a choice. We can stay on the path that we're on right now. This is going out to 2200. It's quite a ways in the future, but it's not good. We don't want to be on this path. We don't want to warm more than 2 degrees. We really don't. There is this other path that can take us back to somewhat cooler temperatures. Those are the kinds of decisions and changes that have to get made that this group here is working on. So not only the science behind what's going on in the climate system, but also what policies and what solutions are out there. That's what Woods Hole Research center is really focused on. And sadly, right now the situation is not very optimistic. If we look at how fossil fuels are emitting carbon into the atmosphere or how we're burning carbon and these different types of fossil fuels are contributing to the carbon in the atmosphere. We've got the coal fired power generation and other coal use and then the other fossil fuels, they're all still going up. We've got to turn that around and we got to do it soon because if we don't, we're going to see temperatures in the United States get truly unbearable. So this is the number of days of above 100 degrees that are projected for the middle of the century and by the end of the century. So huge sections of this country, if we stay on the path we're on, will be almost unlivable and will require a lot more energy just to be able to live in those areas. But agriculture, it's going to have a hard time. And even here we're pretty insulated from a lot of these changes. But we're projected, our temperature is projected to change here in Rhode island is the closest one I could find, about 9 degrees by 2100. That's similar to what Florida is experiencing today. So our climate is heading towards what they have now. All right, so one more word about sea ice because it is a really important indicator of the climate system as a whole. It's very sensitive, it's something we can measure pretty well and it's something that we can use climate models to try to get a handle on how it's going to change in the future as well. So what we're looking at here is how in the past, which is the gray stuff here, how climate models are able to simulate what happened in the past compared to the black line here, which is what actually happened. So they're doing a pretty good job simulating how the sea ice has disappeared, has started to really disappear recently. I'd say maybe they're a little slower than the real world as we look into just the last few years here. But what's really important is that as we go into the future again, it's showing us what our choices are if we do nothing. This line here is an essentially ice free Arctic in the summertime. We're not talking about very long. We expect to see an ice free summer almost any time now, but almost certainly by 2040, certainly by 2050. That's almost a certainty because as you can see, these different paths don't diverge much until we get out to that point. And of course, this green curve is what we could see if we really get serious and figure out how to reduce our emissions of carbon into the atmosphere. So there is hope. This is a painting done by the son of One of my PhD students he's 13 years old now. Last time I saw him, he was about this tall. And he sent this to me and I thought it was pretty amazing. So I encourage you to support organizations like this that are really trying to find those solutions so that we don't leave this for our kids and their kids. Thank you.
I was wondering how the jet stream affects the processes like the North Atlantic Oscillation and so events that often influence.
Climate change between the ocean and the coastal land areas.
So the North Atlantic Oscillation is basically the difference in pressure between the low pressure area that sits over Iceland and the high pressure area that sits over Bermuda. When that difference is really large, it's said that the North Atlantic Oscillation is positive. And when that difference is smaller, that's a negative North Atlantic Oscillation. So the jet stream dictates that North Atlantic Oscillation when it tends to be really wavy, it's because that north south temperature difference is weak and it tends to also create a smaller difference in pressure but between those two centers. So usually when the jet stream is weak, we tend to see also a negative North Atlantic Oscillation, which tends to cause kind of unusual weather conditions that can happen in Europe. It's more of a influence on Europe and the middle of the Atlantic, more so than here, but that's what that's about. So it's more the jet stream causing the North Atlantic Oscillation rather than the other way around.
So you're right, this is scarier than what we knew before. But yesterday we thought if we reduced carbon emissions and fossil fuel use and did some reforestation, we might have a remedy and be able to keep away from a tipping point. But you're reporting something that's completely in a different arena, something. So does this knowledge suggest other types of solutions that we haven't yet considered that would improve the situation on global warming and climate change?
Well, to be totally honest, we cannot turn this around, but we can make it less bad, a lot less bad. So we need to do everything in our power. I mean, there's no silver bullet here. We've got to do everything we can do at the local level, the state level, the regional level, the national level, the global level, to reduce how much carbon we are putting into the atmosphere, both by burning fossil fuels, by cutting down forests, by not planting more trees so many ways. So it's all going to happen if we're ever going to bend that curve towards, if you remember those two major scenarios, if we're ever going to get anywhere close to that scenario we'd rather be on. There's technology out there that might make a big difference somehow taking enough carbon out of the atmosphere and burying it in the ground. There's a lot of people working on that, and if we can ramp that up to a big enough scale, that could accelerate our path towards a better future. But it's gotta come from all directions and we've all gotta do our part. And I think there's a lot happening, especially at the local state level, not so much in Washington, D.C. but a lot is happening elsewhere. So I think people are starting to really get the message. And I think, you know, if there's a silver lining to all this extreme weather, it's helping people to see that, oh, my gosh, you know, climate change really is creating a lot of weird weather. I mean, I think the scientists might actually be right. So I think we're actually gaining traction thanks to Mother Nature and thanks to a lot of science, this been done to make these connections between climate change and how weather patterns are changing. What changes do you anticipate in the.
Location and velocity of the Gulf Stream?
Yep, that's a good question. So the Gulf Stream is in the ocean, right? It's the current that starts in the Gulf of Mexico and it runs up the coast of Florida and up the Eastern Seaboard, and then it takes a right turn and it heads over to England. So there's been some really compelling recent research that suggests that the Gulf Stream may actually be slowing down. And the reason, the most likely reason, appears to be related to the melting of Greenland. So Greenland is shedding a lot more fresh water than it used to. There's also more fresh water coming out of the Arctic Ocean because the rivers that flow into the Arctic are putting out more water and. And it comes out, most of it into the North Atlantic. So you might not have noticed, but in addition to those cold areas over eastern North America and Asia during the wintertime, when we were looking at those differences in temperature, there was also a little spot of cold sitting just south of Greenland. And we think that that cold is, is related to all this extra fresh water that is floating on top of the denser, saltier water, and it's preventing mixing and the creating of the very dense, salty water that sinks in the wintertime and is really the thing that creates the whole ocean conveyor belt. So the way that ocean conveyor belt is forced or the thing that makes it happen is the formation of that really salty cold water in the North Atlantic and also the Southern Ocean. So this is kind of being shut down by this extra layer of fresh water that's preventing that formation of dense water. So we're seeing these very warm temperatures along the Eastern seaboard. And you can almost think of it like a pipe backing up that cold, fresh water that's sitting south of Greenland is kind of preventing that warm water from flowing. And so it's backing up along the coast of the Eastern seaboard. That's the current theory about it.
Please join me in thanking Dr. Franklin.
More from Tod





WHRC's Sustainable Science Speaker Series - Dr. Toby McGrath speaks on Sustainable Fisheries